Name
AlphaTrend和布林带相结合的均值回归趋势跟踪策略AlphaTrend-and-Bollinger-Bands-Combined-Mean-Reversion-Trend-Following-Strategy
Author
ChaoZhang
Strategy Description
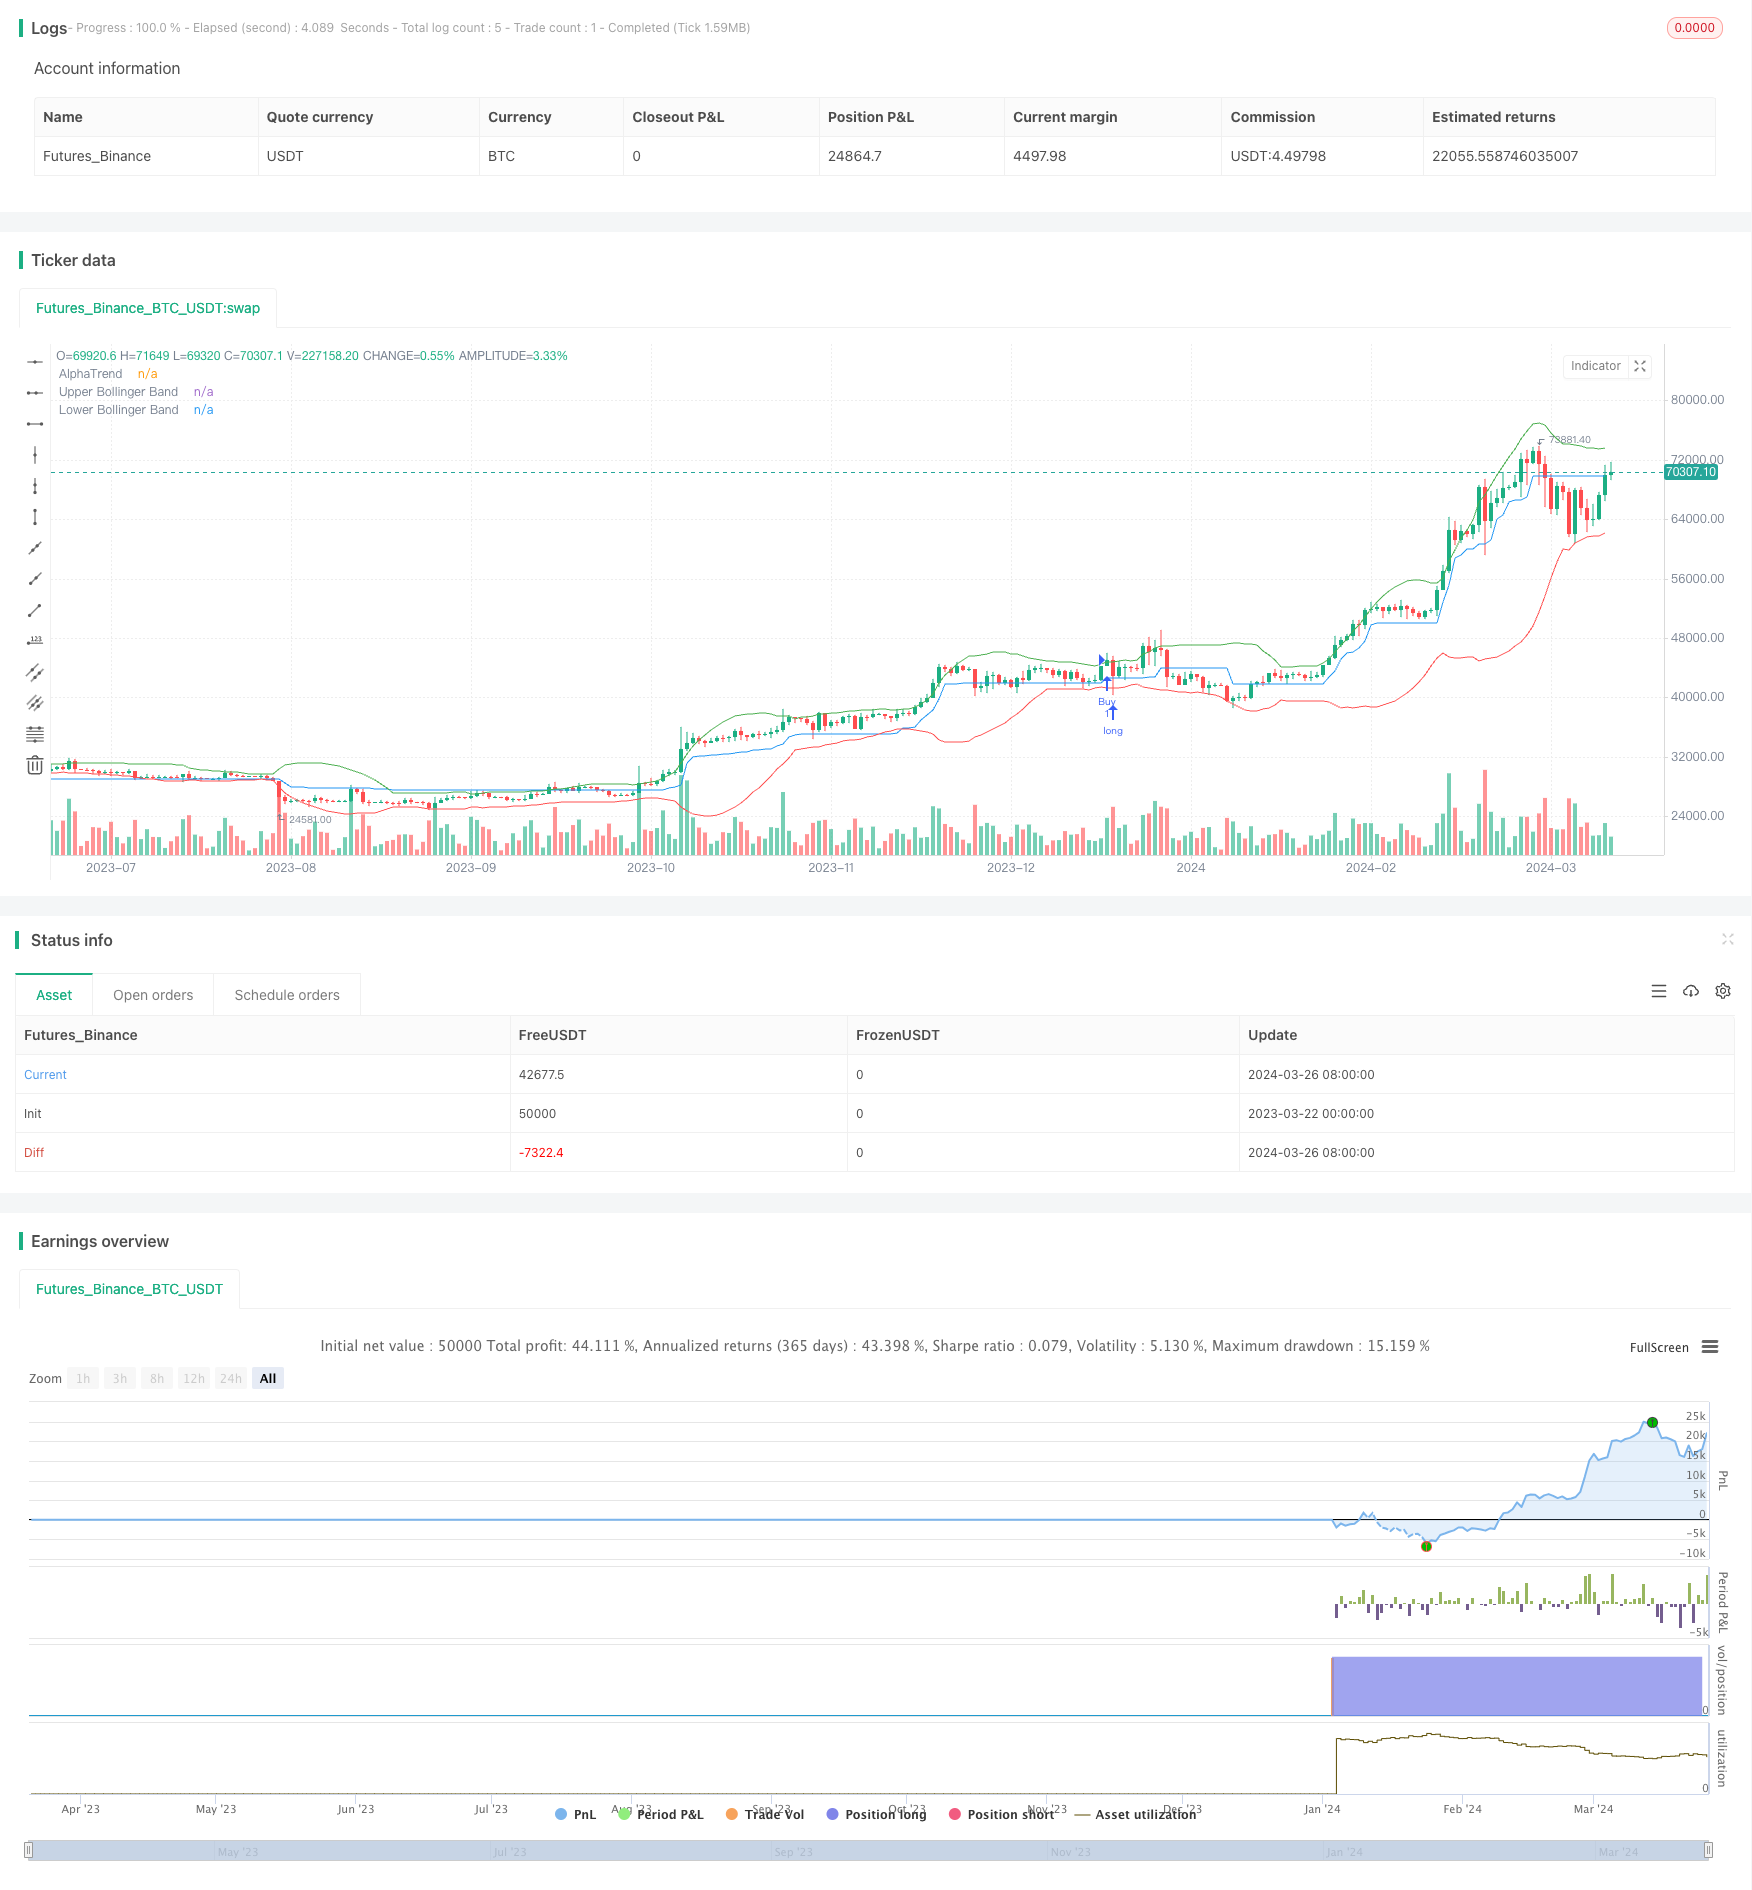
该策略结合了AlphaTrend指标和布林带策略的特点。AlphaTrend指标用于捕捉市场趋势,布林带策略用于捕捉市场的均值回归特性。策略的主要思想是:当价格突破布林带上轨且AlphaTrend指标向上时做多;当价格突破布林带下轨且AlphaTrend指标向下时做空。策略的出场条件是:当价格跌破AlphaTrend指标时平仓。
- AlphaTrend指标的计算:
- 根据novolumedata参数决定使用RSI还是MFI
- 计算ATR作为波动参考
- 计算upT和downT作为趋势判断的上下阈值
- 根据价格与upT和downT的关系更新AlphaTrend指标
- 布林带的计算:
- 计算BBPeriod期间收盘价的简单移动平均值(SMA)作为中轨
- 计算收盘价的标准差(SD)
- 上轨=SMA+BBMultiplier*SD
- 下轨=SMA-BBMultiplier*SD
- 策略进场条件:
- 做多条件:收盘价突破布林带上轨且AlphaTrend指标向上
- 做空条件:收盘价突破布林带下轨且AlphaTrend指标向下
- 策略出场条件:
- 根据AlphaTrend指标:价格跌破AlphaTrend指标时平仓
策略通过结合趋势跟踪和均值回归的特点,在趋势明显时紧跟趋势,在震荡市中博取超额收益。AlphaTrend指标能够根据价格走势灵活调整,对趋势有较好的适应性。同时布林带能够客观刻画价格的相对高低,两者结合可形成有效的进场信号。
- 趋势跟踪与均值回归结合,能够在各种市场状态下把握机会
- AlphaTrend指标能够灵活适应价格走势,权衡了趋势和波动
- AlphaTrend指标同时考虑了价格和成交量信息,信号可靠性高
- 布林带概念简单,能够客观刻画价格的相对高低,与AlphaTrend指标结合,形成了有效的过滤机制
- 参数可调,策略灵活性高,可以根据市场特点进行优化
- AlphaTrend指标对参数相对敏感,参数设置不当可能导致信号失效
- 当市场处于震荡期时,布林带和AlphaTrend结合可能产生频繁的信号
- 策略在突发行情时可能失效
- 固定点位止损可能承担较大风险
- 策略缺乏仓位管理和资金管理
针对以上风险,可以采取以下应对措施:
- 对不同市场和品种分别进行参数优化和回测
- 进一步过滤信号,减少频繁交易带来的成本
- 设置合理的止损点位,严格执行止损
- 引入更加健壮的趋势判断指标,提高趋势把握的准确性
- 在实盘中,严格遵循资金管理原则,降低单笔交易的风险敞口
- 指标参数的优化:对不同品种和周期分别进行参数寻优,提高信号的有效性
- 信号过滤:引入更多过滤条件,如价格突破布林带后必须收盘在布林带外,减少噪音信号
- 止损优化:采用更加灵活的止损策略,如ATR止损或百分比止损
- 仓位管理:根据风险程度动态调整仓位,高风险时降低仓位,低风险时加大仓位
- 结合其他指标:引入更多有效指标,如趋势类指标ADX、动量指标RSI等,进一步提高信号的可靠性
- 资金管理:严格执行资金管理原则,单笔交易风险敞口不超过账户的2%,总风险敞口不超过账户的10%
策略还有很多可以优化的空间。参数优化和信号过滤可以直观地提高策略表现。引入仓位管理可以平滑收益曲线。更加灵活的止损方式可以降低单次交易的风险。通过这些手段的组合优化,可以进一步提高该策略的性能,使其在实盘交易中稳定获利。
该策略巧妙地将趋势跟踪和均值回归这两种常见的量化策略思想结合起来,同时采用了AlphaTrend指标和经典的布林带指标。AlphaTrend指标充分利用价格和成交量信息,在把握趋势的同时很好地适应了市场节奏。而布林带指标客观刻画了价格的相对高低,能够有效捕捉超买超卖的机会。两个指标的结合形成了趋势与价格的共振,能够在趋势行情和震荡行情中灵活把握机会。
策略整体逻辑清晰,参数设置灵活,便于针对不同品种和周期进行优化。同时策略的风险点也比较明显,仓位管理和止损方面还需进一步优化。此外,为了进一步提高信号的可靠性,还可以考虑引入趋势类指标如ADX,动量指标如RSI等。总的来说,该策略是趋势投资和均值回归思想的经典结合,很好地利用了AlphaTrend指标的优点,值得进一步优化和跟踪研究。相信经过进一步的打磨,该策略能够成为实盘交易中的利器。
||
This strategy combines the characteristics of the AlphaTrend indicator and the Bollinger Bands strategy. The AlphaTrend indicator is used to capture market trends, while the Bollinger Bands strategy is used to capture the mean reversion characteristics of the market. The main idea of the strategy is: when the price breaks through the upper Bollinger Band and the AlphaTrend indicator is upward, go long; when the price breaks through the lower Bollinger Band and the AlphaTrend indicator is downward, go short. The exit condition of the strategy is: when the price falls below the AlphaTrend indicator, close the position.
- Calculation of the AlphaTrend indicator:
- Determine whether to use RSI or MFI based on the novolumedata parameter
- Calculate ATR as a volatility reference
- Calculate upT and downT as upper and lower thresholds for trend determination
- Update the AlphaTrend indicator based on the relationship between price and upT and downT
- Calculation of Bollinger Bands:
- Calculate the simple moving average (SMA) of the closing price over the BBPeriod as the middle band
- Calculate the standard deviation (SD) of the closing price
- Upper band = SMA + BBMultiplier * SD
- Lower band = SMA - BBMultiplier * SD
- Strategy entry conditions:
- Long condition: closing price breaks above the upper Bollinger Band and AlphaTrend indicator is upward
- Short condition: closing price breaks below the lower Bollinger Band and AlphaTrend indicator is downward
- Strategy exit conditions:
- Based on the AlphaTrend indicator: close the position when the price falls below the AlphaTrend indicator
The strategy combines the characteristics of trend following and mean reversion. It closely follows the trend when the trend is obvious and seeks excess returns in range-bound markets. The AlphaTrend indicator can flexibly adjust according to price movements and has good adaptability to trends. At the same time, Bollinger Bands can objectively depict the relative highs and lows of prices. The combination of the two can form effective entry signals.
- Combining trend following and mean reversion, it can seize opportunities in various market conditions
- The AlphaTrend indicator can flexibly adapt to price movements and balance trends and volatility
- The AlphaTrend indicator considers both price and volume information, making the signals highly reliable
- The concept of Bollinger Bands is simple and can objectively depict the relative highs and lows of prices. Combined with the AlphaTrend indicator, it forms an effective filtering mechanism
- Parameters are adjustable, and the strategy has high flexibility, which can be optimized according to market characteristics
- The AlphaTrend indicator is relatively sensitive to parameters, and improper parameter settings may cause the signals to fail
- When the market is in a range-bound period, the combination of Bollinger Bands and AlphaTrend may generate frequent signals
- The strategy may fail in the event of sudden market movements
- Fixed stop-loss points may bear greater risks
- The strategy lacks position management and capital management
In response to the above risks, the following measures can be taken:
- Parameter optimization and backtesting for different markets and varieties
- Further filter signals to reduce costs caused by frequent trading
- Set reasonable stop-loss points and strictly execute stop-loss
- Introduce more robust trend determination indicators to improve the accuracy of trend identification
- In actual trading, strictly follow capital management principles to reduce the risk exposure of a single transaction
- Optimization of indicator parameters: perform parameter optimization for different varieties and periods to improve the effectiveness of signals
- Signal filtering: introduce more filtering conditions, such as the price must close outside the Bollinger Bands after breaking through, to reduce noise signals
- Stop-loss optimization: adopt more flexible stop-loss strategies, such as ATR stop-loss or percentage stop-loss
- Position management: dynamically adjust positions according to the level of risk, reducing positions during high-risk periods and increasing positions during low-risk periods
- Combine with other indicators: introduce more effective indicators, such as trend indicators like ADX and momentum indicators like RSI, to further improve the reliability of signals
- Capital management: strictly implement capital management principles, with the risk exposure of a single transaction not exceeding 2% of the account and the total risk exposure not exceeding 10% of the account
The strategy still has a lot of room for optimization. Parameter optimization and signal filtering can intuitively improve strategy performance. Introducing position management can smooth the return curve. More flexible stop-loss methods can reduce the risk of a single transaction. Through the combined optimization of these methods, the performance of the strategy can be further improved, enabling it to steadily profit in actual trading.
This strategy ingeniously combines two common quantitative strategy ideas: trend following and mean reversion, while employing the AlphaTrend indicator and the classic Bollinger Bands indicator. The AlphaTrend indicator makes full use of price and volume information, adapting well to market rhythms while grasping trends. The Bollinger Bands indicator objectively depicts the relative highs and lows of prices and can effectively capture overbought and oversold opportunities. The combination of the two indicators forms a resonance of trend and price, enabling flexible capture of opportunities in both trending and range-bound markets.
The overall logic of the strategy is clear, and the parameter settings are flexible, making it convenient to optimize for different varieties and periods. At the same time, the risk points of the strategy are also relatively obvious, and position management and stop-loss need further optimization. In addition, to further improve the reliability of signals, it is worth considering introducing trend indicators such as ADX and momentum indicators such as RSI. Overall, this strategy is a classic combination of trend investing and mean reversion ideas, making good use of the advantages of the AlphaTrend indicator and deserving further optimization and follow-up research. It is believed that after further refinement, this strategy can become a powerful tool in actual trading. [/trans]
Strategy Arguments
| Argument | Default | Description |
|---|---|---|
| v_input_float_1 | true | Multiplier |
| v_input_1 | 14 | Common Period |
| v_input_2_close | 0 | src: close |
| v_input_3 | false | Change calculation (no volume data)? |
| v_input_int_1 | 20 | BB Period |
| v_input_float_2 | 2 | BB Multiplier |
| v_input_bool_1 | true | Enable Exit Condition for Strategy 1 |
Source (PineScript)
/*backtest
start: 2023-03-22 00:00:00
end: 2024-03-27 00:00:00
period: 1d
basePeriod: 1h
exchanges: [{"eid":"Futures_Binance","currency":"BTC_USDT"}]
*/

// This Pine Script™ code is subject to the terms of the Mozilla Public License 2.0 at https://mozilla.org/MPL/2.0/
// © brlu99


//@version=5
strategy(title="AlphaTrend and Bollinger Bands 120324 Strategy", shorttitle="AT_BB120324", overlay=true, format=format.price, precision=2, pyramiding=0)

// AlphaTrend Indicator
coeff = input.float(1, 'Multiplier', step=0.1)
AP = input(14, 'Common Period')
ATR = ta.sma(ta.tr, 20)
src = input(close)
novolumedata = input(title='Change calculation (no volume data)?', defval=false)
upT = low - ATR * coeff
downT = high + ATR * coeff
AlphaTrend = 0.0
AlphaTrend := (novolumedata ? ta.rsi(src, AP) >= 50 : ta.mfi(hlc3, AP) >= 50) ? upT < nz(AlphaTrend[1]) ? nz(AlphaTrend[1]) : upT : downT > nz(AlphaTrend[1]) ? nz(AlphaTrend[1]) : downT

// Bollinger Bands Strategy
BBPeriod = input.int(20, title="BB Period", minval=1)
BBMultiplier = input.float(2.0, title="BB Multiplier", minval=0.1)
basis = ta.sma(close, BBPeriod)
dev = ta.stdev(close, BBPeriod)
upper = basis + BBMultiplier * dev
lower = basis - BBMultiplier * dev

// Strategy Conditions
longCondition = ta.crossover(close, upper) and ta.crossover(AlphaTrend, AlphaTrend[1])
shortCondition = ta.crossunder(close, lower) and ta.crossunder(AlphaTrend, AlphaTrend[1])
// Exit conditions for Strategy 6
longExit_AT_6 = ta.crossover(close, AlphaTrend)
shortExit_AT_6 = ta.crossunder(close, AlphaTrend)
// Exit condition series
exit1 = input.bool(true, title="Enable Exit Condition for Strategy 1")

// Define exit conditions for each strategy
exit1_condition = close < AlphaTrend ? 1.0 : na

// Strategy Actions
strategy.entry("Buy", strategy.long, when=longCondition)
strategy.entry("Sell", strategy.short, when=shortCondition)
// Exit conditions for Strategy 1
strategy.exit("Buy", "longExit_AT_6", stop = exit1_condition, when =shortExit_AT_6 )
strategy.exit("Sell", "shortExit_AT_6", stop = exit1_condition, when =longExit_AT_6)

// Plotting
plot(AlphaTrend, color=color.blue, title="AlphaTrend")
plot(upper, color=color.green, title="Upper Bollinger Band")
plot(lower, color=color.red, title="Lower Bollinger Band")

// Alerts
alertcondition(longCondition, title='Potential Buy Signal', message='AlphaTrend crossed above Upper Bollinger Band')
alertcondition(shortCondition, title='Potential Sell Signal', message='AlphaTrend crossed below Lower Bollinger Band')
Detail
https://www.fmz.com/strategy/446435
Last Modified
2024-03-28 16:32:35