Name
Bollinger带动量突破策略Bollinger-Bands-Momentum-Breakout-Strategy
Author
ChaoZhang
Strategy Description
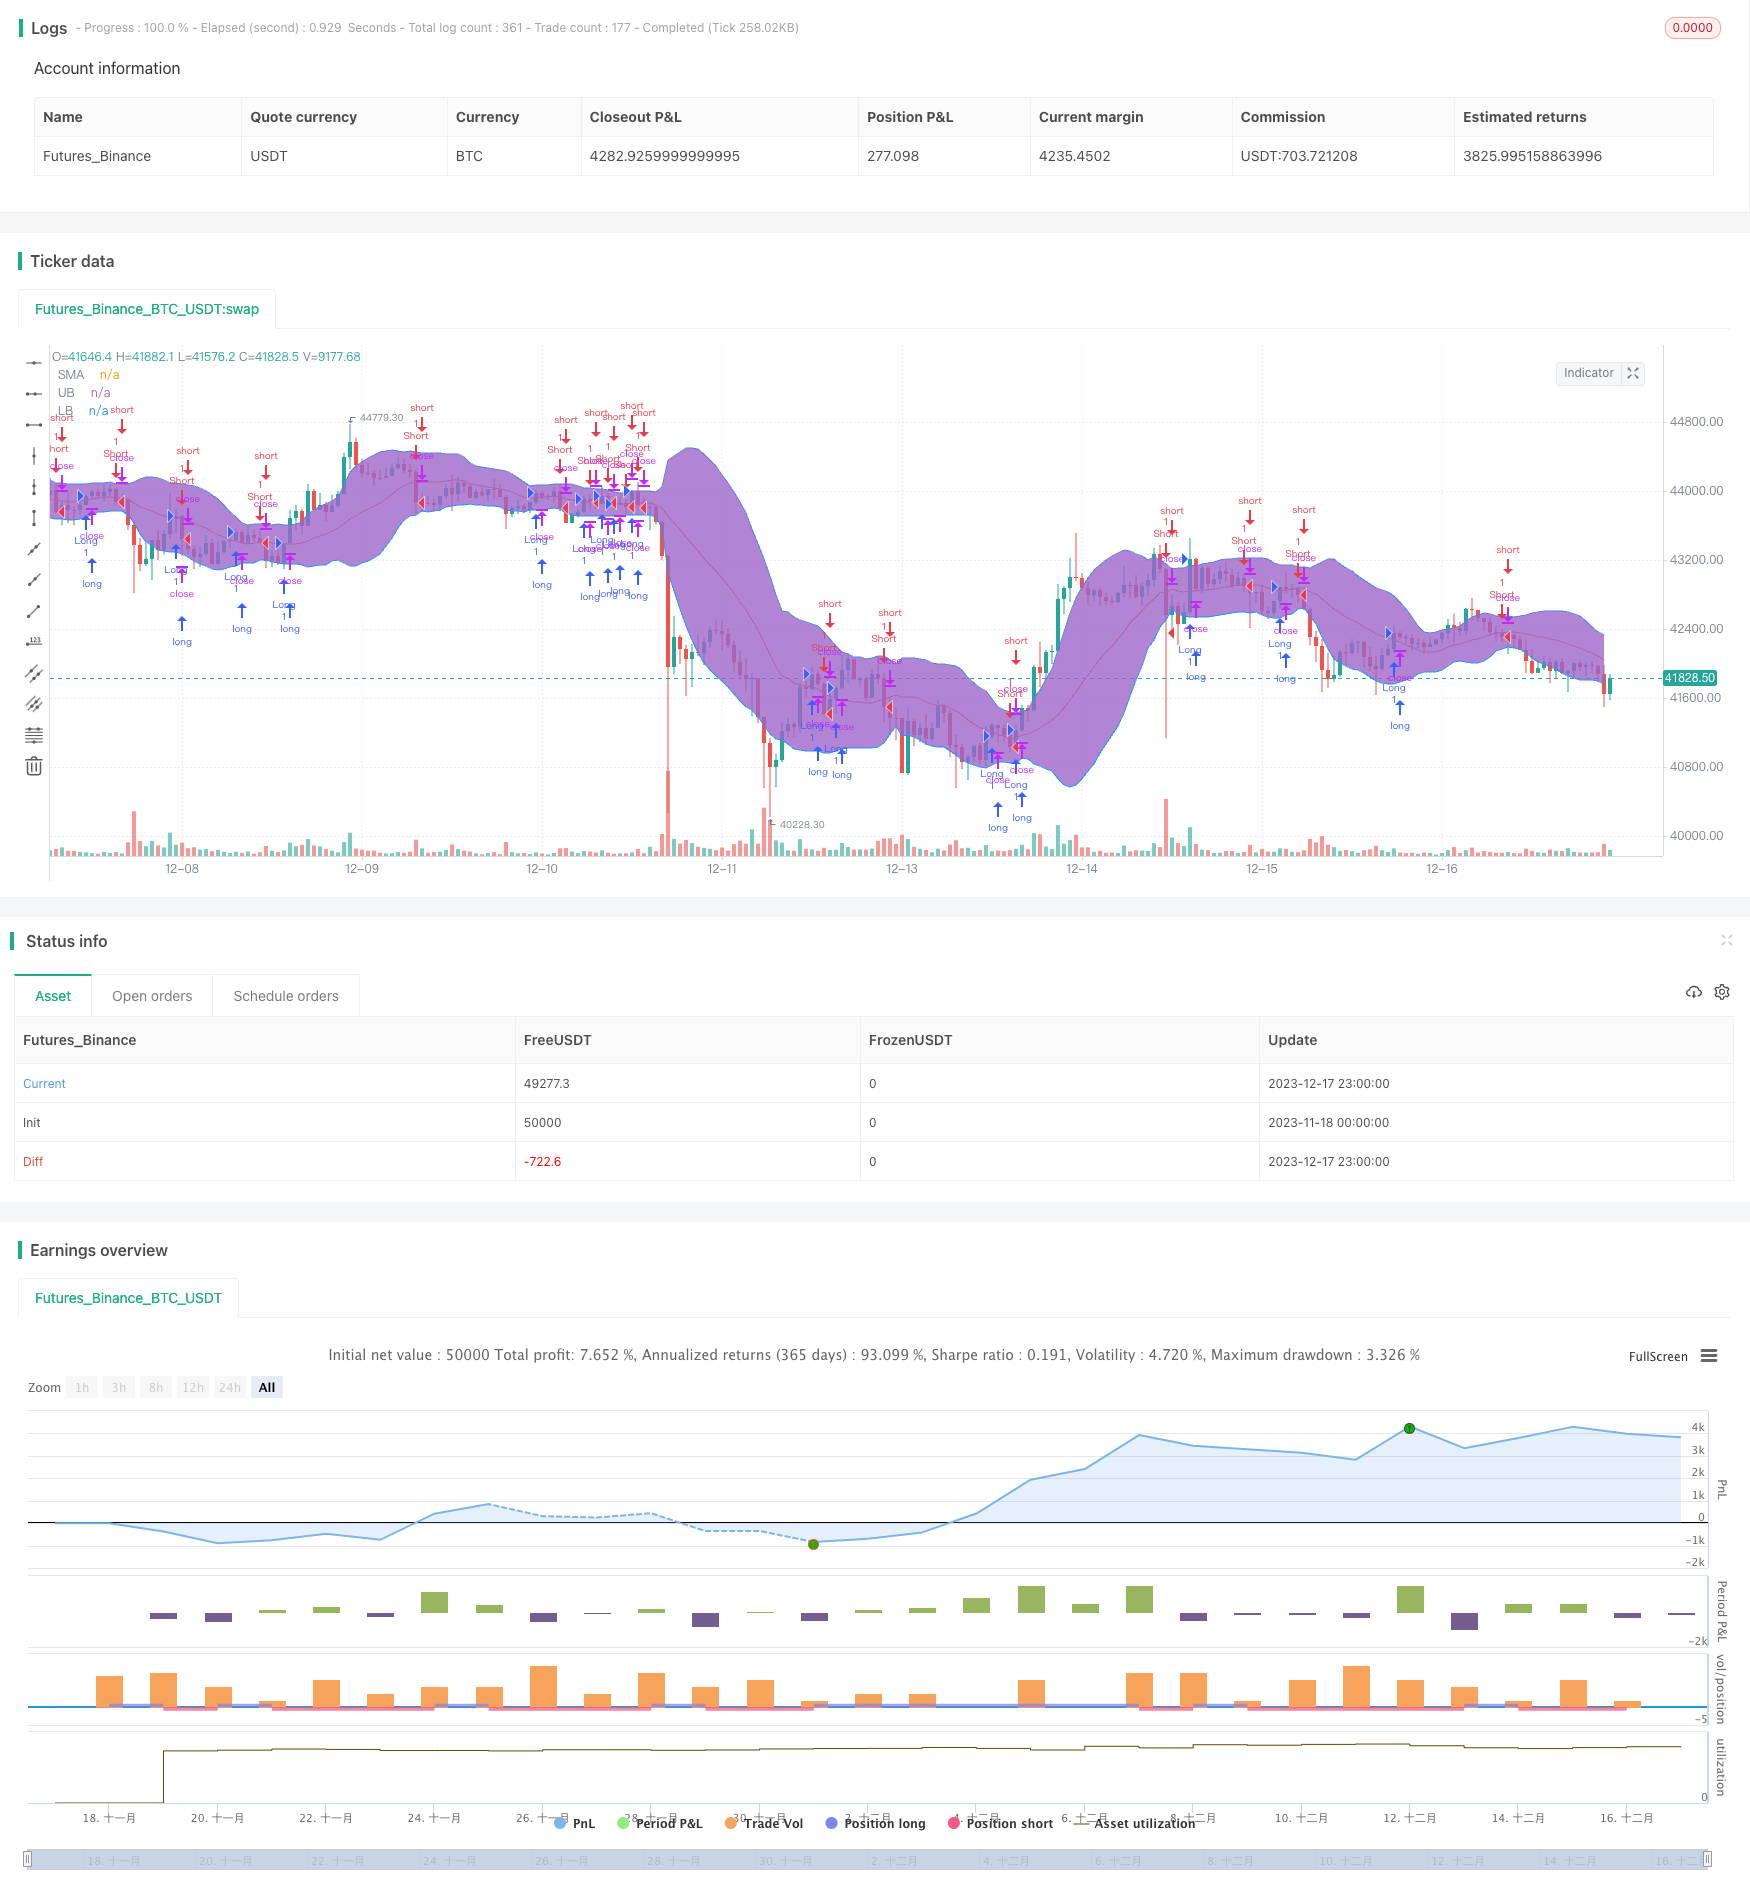
Bollinger带动量突破策略是一种典型的利用Bollinger带指标识别股票价值的量化交易策略。该策略运用Bollinger带的上轨和下轨来判断股票是否被高估或低估,并结合股票价格的移动平均线来发出交易信号。当价格突破上轨时,认为股票被低估,形成买入信号;当价格跌破下轨时,认为股票被高估,形成卖出信号。
Bollinger带是由中轨线、上轨线和下轨线组成。中轨线是n天的简单移动平均线;上下轨线分别是中轨线上下两个标准差的位置。当股价接近上轨时被认为股价被高估,接近下轨时被认为股价被低估。
该策略首先计算20天的股价中轨线、上轨线和下轨线。然后判断股价是否高于或低于中轨线,如果高于中轨线则为买入信号,低于中轨线则为卖出信号。同时,如果股价上穿上轨线,作为平仓信号,股价下穿下轨线,作为平仓信号。
这种策略最大的优势是利用Bollinger带判断股价的高低估,避免了盲目交易的问题。当股价被高估时,策略会发出卖出信号;当股价被低估时,策略会发出买入信号。这样可以有效过滤掉一些噪音,进入的交易信号质量较高。
另外,该策略加入了移动平均线作为辅助判断指标。股价实际突破移动平均线,也是较强的趋势信号。结合Bollinger带的高低估判断,可以使策略信号更加准确。
该策略最大的风险在于Bollinger带指标本身。当股票价格出现异常波动时,Bollinger带的范围也会随之改变。这时就可能出现股票价格明显被高估或低估,但是并未触及Bollinger带的上下轨。从而导致策略无法给出交易信号的问题。
另外,如果仅仅依赖技术指标,而没有考虑股票基本面信息,也会存在一定的风险。比如说盈利下滑但股价被低估的股票,或者业绩高速增长但股价偏高的个股。这些情况下,策略信号可能与股票实际价值存在一定偏差。
这种策略可以从以下几个方面进行优化:
-
增加止损机制。当股票价格与买入价格相比发生一定比例的下跌时,强制止损退出。这可以有效控制策略的最大损失。
-
结合股票基本面与技术指标。加入如PE,PB等基本面指标的判断规则,避免买入实际上已经高估的股票。
-
动态调整参数。使Bollinger带的周期长度、标准差倍数等参数根据不同股票波动率进行动态调整。这可以使Bollinger带更好地适应个股的价格波动。
Bollinger带动量突破策略通过辅助判断指标发出交易信号,避免了盲目交易的风险,可以有效过滤噪音信号。同时也存在一定局限,无法完全避免异常波动的影响。未来可以从止损、结合基本面、动态参数调整等方面进行优化,使策略更稳定可靠。
||
The Bollinger Bands momentum breakout strategy is a typical quantitative trading strategy that utilizes the Bollinger Bands indicator to identify mispriced stocks. This strategy uses the upper and lower bands of Bollinger Bands to judge whether a stock is overvalued or undervalued, and combines the moving average of the stock price to generate trading signals. When the price breaks through the upper band, the stock is considered undervalued and a buy signal is formed. When the price breaks through the lower band, the stock is considered overvalued and a sell signal is formed.
The Bollinger Bands consist of a middle band, an upper band and a lower band. The middle band is the n-day simple moving average; the upper and lower bands are respectively two standard deviations above and below the middle band. When the stock price is close to the upper band, it is considered overvalued, and when it is close to the lower band, it is considered undervalued.
This strategy first calculates the 20-day middle, upper and lower Bollinger Bands. Then it judges whether the stock price is higher or lower than the middle band. If it is higher than the middle band, a buy signal is formed. If it is lower than the middle band, a sell signal is formed. At the same time, if the stock price breaks through the upper band, it serves as a closing signal, and if the price breaks through the lower band, it also serves as a closing signal.
The biggest advantage of this strategy is that it uses Bollinger Bands to judge the overvaluation and undervaluation of stock prices, avoiding the problem of blind trading. When the stock price is overvalued, the strategy will issue a sell signal. When the stock price is undervalued, the strategy will issue a buy signal. This can effectively filter out some noise and the quality of trading signals entered is higher.
In addition, the moving average is used as an auxiliary judgment indicator in this strategy. The actual breakthrough of the moving average by the stock price is also a strong trend signal. Combined with Bollinger Band's judgment of overvaluation and undervaluation, the strategy signals can be more accurate.
The biggest risk of this strategy lies in the Bollinger Bands indicator itself. When the stock price fluctuates abnormally, the range of Bollinger Bands will also change accordingly. At this time, there may be situations where the stock price is clearly overvalued or undervalued, but has not reached the upper or lower rails of the Bollinger Bands. As a result, the strategy fails to give trading signals.
In addition, relying solely on technical indicators without considering the fundamentals of the stock also poses some risks. For example, stocks with declining profits but undervalued prices, or stocks with high-speed earnings growth but relatively high prices. In these cases, there may be some deviation between strategy signals and actual stock value.
This strategy can be optimized in the following aspects:
-
Add a stop loss mechanism. When the stock price decreases by a certain percentage compared to the purchase price, forced stop loss exit. This can effectively control the maximum loss of the strategy.
-
Combine fundamentals with technical indicators. Add judgment rules such as PE and PB ratios to avoid buying stocks that are already overvalued.
-
Dynamically adjust parameters. Make parameters of Bollinger Bands such as cycle length and standard deviation multiplier adjust dynamically according to volatility of different stocks. This allows Bollinger Bands to better adapt to stock price fluctuations.
The Bollinger Bands momentum breakout strategy avoids the risk of blind trading by issuing trading signals with auxiliary judgment indicators, which can effectively filter out noise signals. At the same time, there are certain limitations that cannot completely avoid the impact of abnormal fluctuations. In the future, optimization can be carried out in aspects such as stop loss, combining fundamentals, and dynamically adjusting parameters to make the strategy more stable and reliable.
[/trans]
Strategy Arguments
| Argument | Default | Description |
|---|---|---|
| v_input_1 | 20 | Period |
| v_input_2 | 1.5 | Standard Deviation |
Source (PineScript)
/*backtest
start: 2023-11-18 00:00:00
end: 2023-12-18 00:00:00
period: 1h
basePeriod: 15m
exchanges: [{"eid":"Futures_Binance","currency":"BTC_USDT"}]
*/

//@version=4
strategy(title="NoScoobies Bollinger Bands", overlay=true)
source = close
length = input(20, minval=1, title = "Period") //Length of the Bollinger Band
mult = input(1.5, minval=0.001, maxval=50, title = "Standard Deviation") // Use 1.5 SD for 20 period MA; Use 2 SD for 10 period MA

basis = sma(source, length)
dev = mult * stdev(source, length)

upper = basis + dev
lower = basis - dev

long=crossover(source, basis)
short=crossunder(source, basis)
close_long=crossunder(source, upper)
close_short=crossover(source, lower)

if long
    strategy.entry("Long", strategy.long)
    strategy.close("Long", when = close_long)

if short
    strategy.entry("Short", strategy.short)
    strategy.close("Short", when = close_short)

plot(basis, color=color.red,title= "SMA")
p1 = plot(upper, color=color.blue,title= "UB")
p2 = plot(lower, color=color.blue,title= "LB")
fill(p1, p2)
Detail
https://www.fmz.com/strategy/435903
Last Modified
2023-12-19 16:24:24