Name
Hilo激活器买卖信号策略Hilo-Activator-Buy-Sell-Signals-Strategy
Author
ChaoZhang
Strategy Description
[trans]
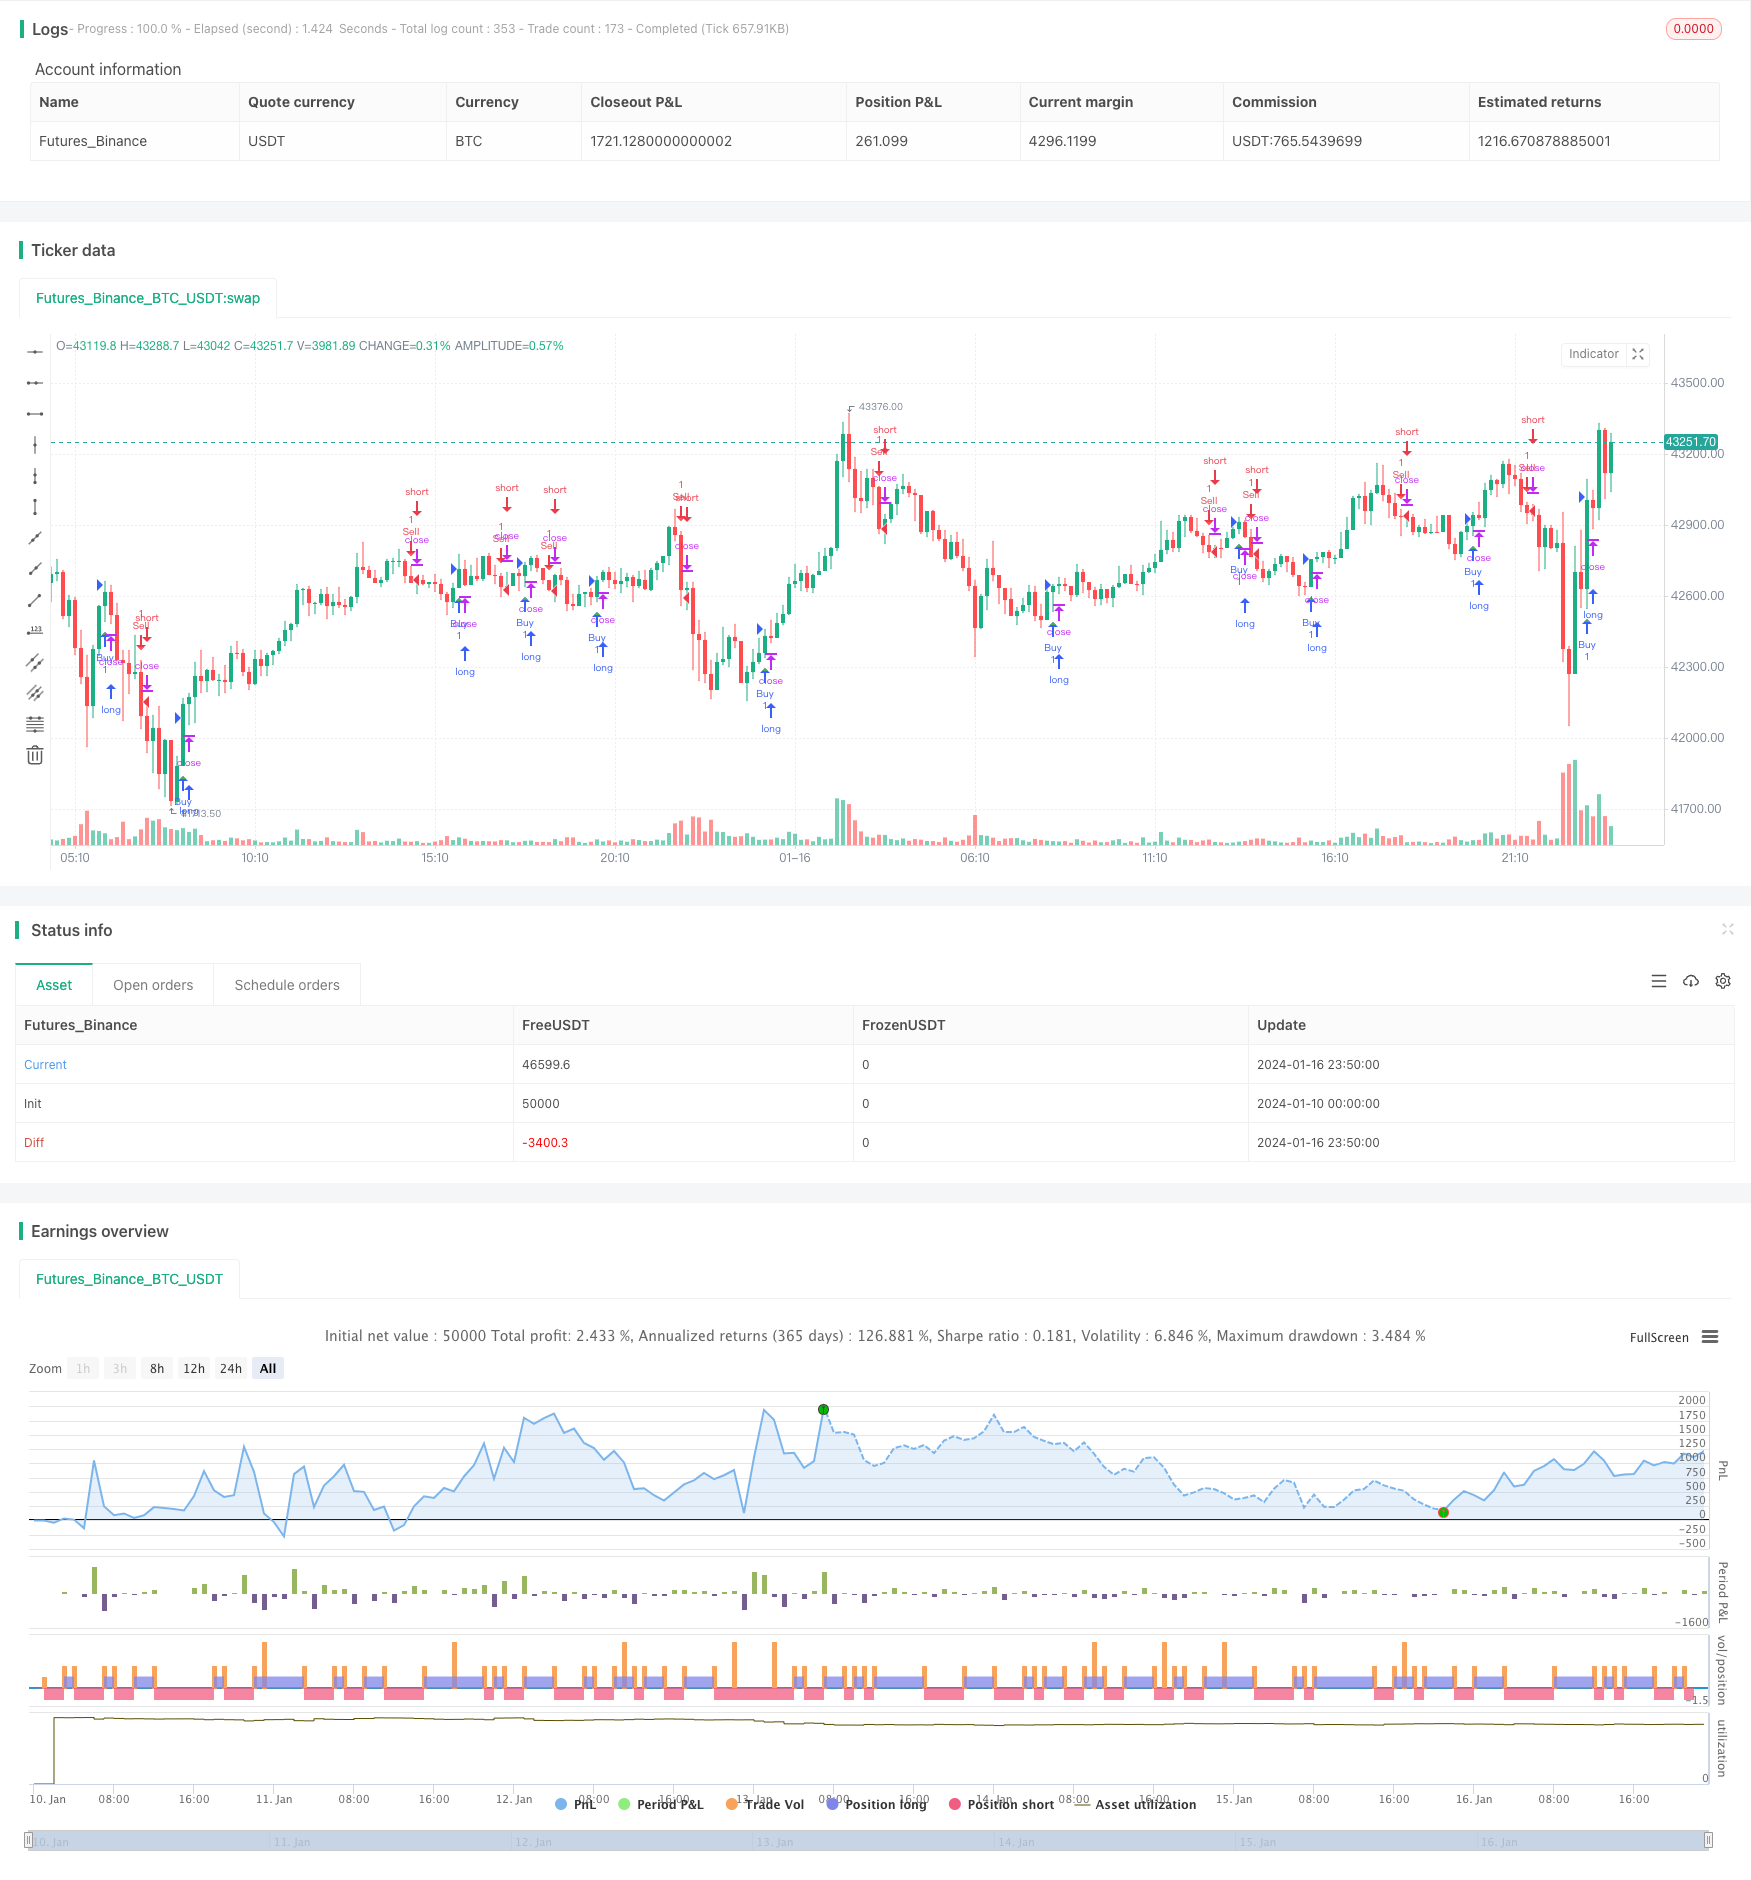
Hilo激活器买卖信号策略是一种基于Hilo激活器指标的量化交易策略。它使用Hilo指标动态生成关键的价格阈值,并在收盘价突破这些价格水平时产生买入和卖出信号。该策略支持自动实际交易,能够基于规则建立多头和空头头寸。
该策略使用自定义变量设置Hilo激活器指标的周期长度、平移大小和是否使用指数移动平均线。Hilo指标包含代表做多和做空决策的关键价格线。当收盘价上穿Hilo线时,产生买入信号;当收盘价下穿Hilo线时,产生卖出信号。为了清晰可视化信号,该策略使用绿色三角标记买入信号,使用红色三角标记卖出信号。
Hilo激活器买卖信号策略具有如下优势:
- 使用Hilo指标识别关键支撑与压力位,可以捕捉价格反转机会
- 参数可调整,可以针对不同市场和交易品种进行优化
- 结合可视化信号设计,直观简洁
- 支持自动交易实施策略
该策略也存在一些风险:
- Hilo指标存在滞后,可能错过部分价格移动
- 需要适当调整参数,避免产生过多无效信号
- 自动交易风险需要评估和控制
该策略可以从以下几个方面进行优化:
- 结合其他指标过滤无效信号,提高信号质量
- 增加止损机制,控制单笔损失
- 优化参数设置,适应更广泛的市场情况
- 利用机器学习方法动态优化参数
Hilo激活器买卖信号策略为量化交易提供了一个简单可靠的基础框架。该策略运用Hilo指标判定关键价格,在突破这些价格时产生交易信号。该策略可视化设计优良,参数可调整,支持自动化交易。通过进一步的测试和优化,可以使其适应更多不同的品种和交易环境,从而获得更稳定的超额收益。
||
The Hilo Activator Buy Sell Signals strategy is a quantitative trading strategy based on the Hilo Activator indicator. It uses the Hilo indicator to dynamically generate key price thresholds and trigger buy and sell signals when the closing price breaks through these price levels. The strategy supports automated actual trading to establish long and short positions based on rules.
The strategy uses custom variables to set the period, shift, and whether to use exponential moving average for the Hilo Activator indicator. The Hilo indicator contains lines representing key decision price levels for long and short. When the closing price crosses above the Hilo line, a buy signal is generated. When the closing price crosses below the Hilo line, a sell signal is triggered. To clearly visualize the signals, the strategy uses green triangles to mark buy signals and red triangles for sell signals.
The Hilo Activator Buy Sell Signals Strategy has the following advantages:
- Identify key support and resistance levels using Hilo indicator to capture price reversal opportunities
- Adjustable parameters for optimization across different markets and trading instruments
- Intuitive visual design with signals
- Support automated trading execution of the strategy
There are also some risks with this strategy:
- Hilo indicator could lag and miss some price moves
- Need to adjust parameters properly to avoid excessive invalid signals
- Risks associated with automated trading needs assessment and control
The strategy can be optimized from the following aspects:
- Incorporate other filters to improve signal quality
- Add stop loss mechanisms to control single loss
- Optimize parameter settings to adapt to more market conditions
- Utilize machine learning methods to dynamically optimize parameters
The Hilo Activator Buy Sell Signals Strategy provides a simple yet reliable quantitative trading framework, identifying key prices to trade based on Hilo indicator thresholds and breakouts. With excellent visual design, adjustable parameters, and automated trading support, further testing and enhancements could make the strategy robust across more instruments and market environments to generate steady excess returns.
[/trans]
Strategy Arguments
| Argument | Default | Description |
|---|---|---|
| v_input_1 | 8 | Período |
| v_input_2 | true | Deslocamento |
| v_input_3 | false | Média Móvel Exponencial |
Source (PineScript)
/*backtest
start: 2024-01-10 00:00:00
end: 2024-01-17 00:00:00
period: 10m
basePeriod: 1m
exchanges: [{"eid":"Futures_Binance","currency":"BTC_USDT"}]
*/

//@version=4
strategy("Hilo Activator com Sinais de Compra e Venda", overlay=true)

// Entradas personalizadas
period = input(8, title="Período")
shift = input(1, title="Deslocamento")
exp = input(false, title="Média Móvel Exponencial")
max = exp ? ema(high[shift], period) : sma(high[shift], period)
min = exp ? ema(low[shift], period) : sma(low[shift], period)
pos = close > max ? -1 : close < min ? 1 : 0
pos := pos == 0 ? na(pos[1]) ? 0 : pos[1] : pos
hilo = pos == 1 ? max : min

// Condições para sinais de compra e venda
buySignal = crossover(close, hilo)
sellSignal = crossunder(close, hilo)

plotshape(buySignal, style=shape.triangleup, location=location.belowbar, color=color.green, size=size.small)
plotshape(sellSignal, style=shape.triangledown, location=location.abovebar, color=color.red, size=size.small)

// plotbar(hilo,hilo,hilo,hilo,color=pos==1?color.red:color.green)

strategy.entry("Buy", strategy.long, when = buySignal)
strategy.entry("Sell", strategy.short, when = sellSignal)
Detail
https://www.fmz.com/strategy/439248
Last Modified
2024-01-18 15:56:51