Name
Ichimoku云带与布林带组合交易策略Ichimoku-Cloud-and-Bollinger-Bands-Combination-Trading-Strategy
Author
ChaoZhang
Strategy Description
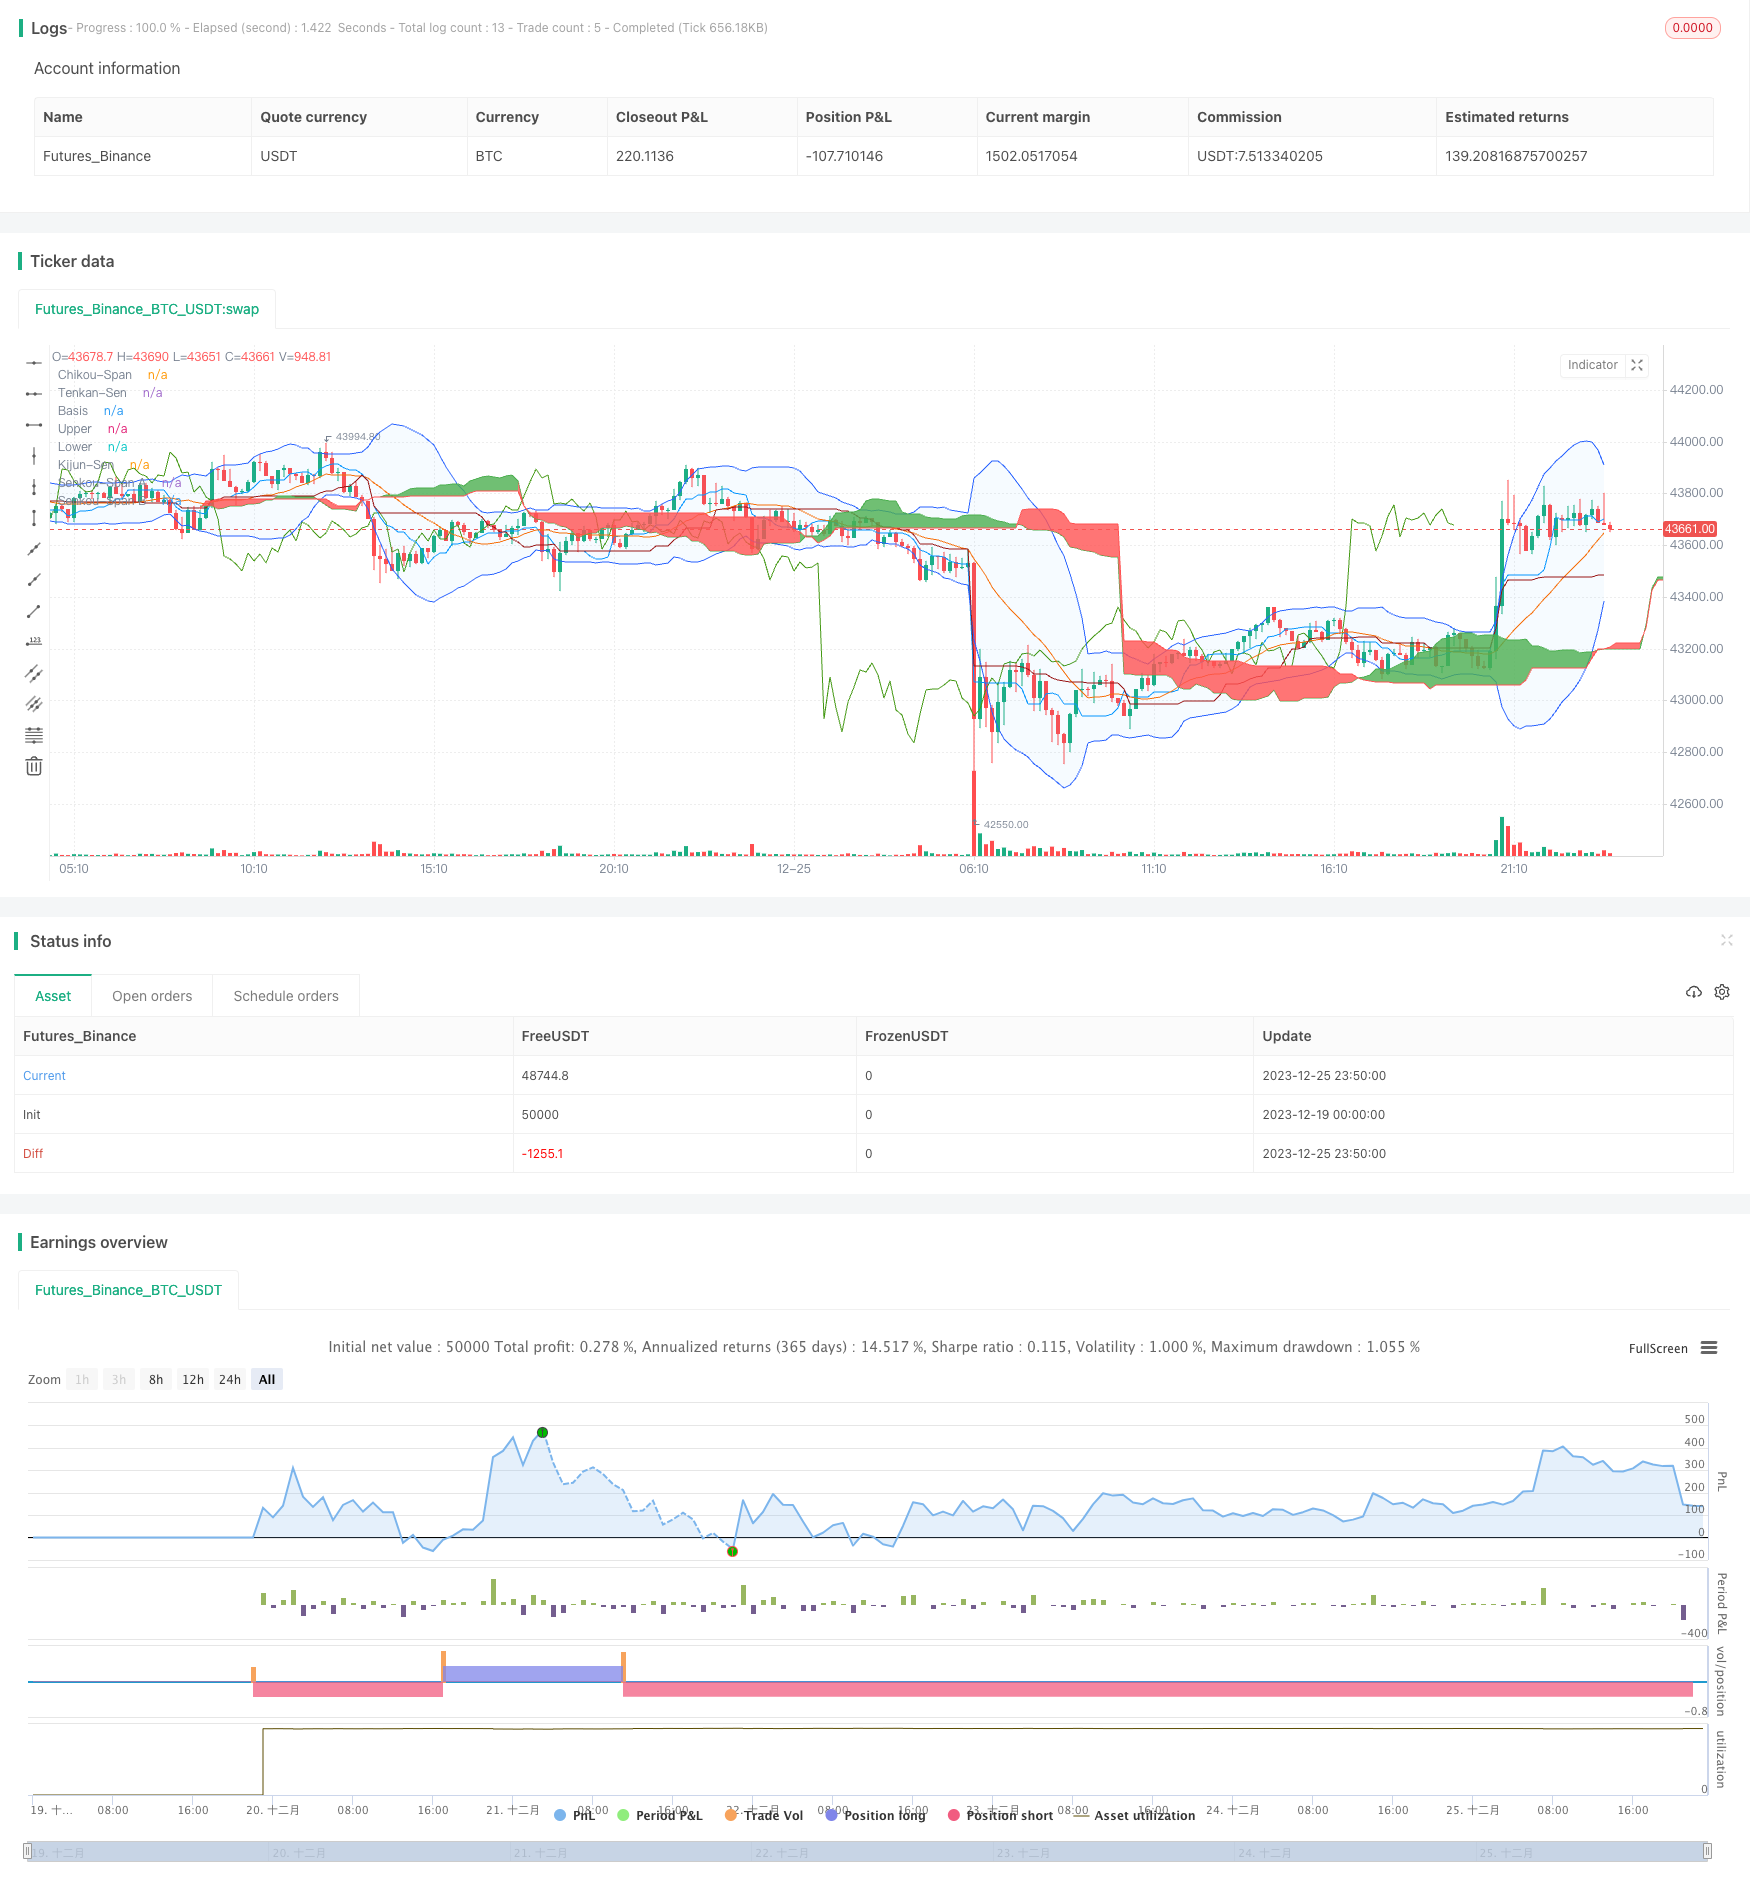
本策略将一种日本指标一云图与布林带指标组合,形成交易信号,进行多空判断。策略可以有效判断市场趋势,并在布林带指标发出多空信号时进行判断,避免错误交易。
-
一云图由转换线、基准线、延迟线、先行线组成。转换线为9日均线,基准线为26日均线。当转换线在基准线之上时为多头信号,反之为空头信号。
-
延迟线即价格的延迟移动。当延迟线在上方时表示多头趋势,下方为空头。
-
云带由两条先行线组成,分别为52日均线和26日均线的均值。价格在云带之上视为多头,下方为空头。
-
布林带由n日均线及标准差构成,为股价波动带。当价格突破上带时看多,下破下带时看空。
-
本策略在一云图发出多空信号时,同时判断布林带的突破,形成交易规则。如转换线向上突破基准线,延迟线在上方,价格突破云带,并突破布林带上带时,为做多信号。
-
一云图判断趋势清晰,转换线和延迟线可判断短期趋势,云带判断中长期趋势方向。
-
布林带判断价格是否过冲,可有效过滤掉部分不必要交易。
-
组合指标,使交易信号更加清晰可靠,避免交易风险。
-
布林带参数设置不当可能导致交易信号不准确。应根据不同标的谨慎设置参数。
-
应适当调整持仓比例以控制风险。持仓过大可能导致亏损扩大。
-
可以考虑加入止损策略,在价格向不利方向运行超过一定幅度时止损。
-
可以测试更多指标与一云图进行组合,形成更可靠的交易策略。
本策略有效利用一云图判断趋势方向和布林带指标过滤信号。策略信号较为清晰可靠,通过参数调整和止损优化,可以降低交易风险,获得较好收益。
||
This strategy combines the Japanese Ichimoku Cloud indicator with the Bollinger Bands indicator to generate trading signals for long and short positions. The strategy can effectively determine market trends and make judgments when the Bollinger Bands indicator issues long and short signals to avoid erroneous trades.
-
The Ichimoku Cloud consists of the conversion line, base line, lagging line, and leading lines. The conversion line is a 9-day moving average and the base line is a 26-day moving average. When the conversion line is above the base line, it is a bullish signal, and vice versa for a bearish signal.
-
The lagging line is the lagging movement of prices. When the lagging line is above, it indicates a bullish trend. Below indicates a bearish trend.
-
The cloud bands consist of two leading lines, which are the 52-day moving average and the mean of the 26-day moving average. Prices above the cloud bands are considered bullish, while below is bearish.
-
The Bollinger Bands consist of n-day moving averages and standard deviations, representing volatility bands for prices. A break above the upper band indicates bulls in control while a break below the lower band suggests bears are in control.
-
This strategy forms trading rules based on the signals generated from the Ichimoku Cloud and the breakouts of the Bollinger Bands. For example, when the conversion line has an upward crossover over the base line, the lagging line is above, price breaks through the cloud bands, and also breaks through the upper band of the Bollinger Bands, it triggers a long entry signal.
-
The Ichimoku Cloud clearly judges the trend direction, with the conversion and lagging lines indicating short-term trends and the cloud bands indicating medium to long term trend direction.
-
The Bollinger Bands determine whether prices are overextended, which can effectively filter out some unnecessary trades.
-
The combination of indicators makes trading signals clearer and more reliable, avoiding trading risks.
-
Improper parameter settings for Bollinger Bands may lead to inaccurate trading signals. Parameters should be carefully set according to different underlying assets.
-
The position size should be appropriately adjusted to control risks. Excessively large positions can lead to greater losses.
-
Consider incorporating a stop loss strategy to stop losses when prices move beyond a certain range in an unfavorable direction.
-
Consider testing more indicators combined with the Ichimoku Cloud to form more reliable trading strategies.
This strategy effectively takes advantage of the Ichimoku Cloud to determine trend direction and the Bollinger Bands indicator to filter signals. The strategy signals are relatively clear and reliable. Through parameter adjustment and optimization of stop loss, trading risks can be reduced and good returns can be obtained.
[/trans]
Strategy Arguments
| Argument | Default | Description |
|---|---|---|
| v_input_1 | true | Show Date Range |
| v_input_int_1 | 9 | Tenkan-Sen Bars |
| v_input_int_2 | 26 | Kijun-Sen Bars |
| v_input_int_3 | 52 | Senkou-Span B Bars |
| v_input_int_4 | 26 | Chikou-Span Offset |
| v_input_int_5 | 26 | Senkou-Span Offset |
| v_input_2 | true | Long Entry |
| v_input_3 | true | Short Entry |
| v_input_int_6 | 20 | length |
| v_input_4_close | 0 | Source: close |
| v_input_float_1 | 2 | StdDev |
| v_input_int_7 | false | Offset |
Source (PineScript)
/*backtest
start: 2023-12-19 00:00:00
end: 2023-12-26 00:00:00
period: 10m
basePeriod: 1m
exchanges: [{"eid":"Futures_Binance","currency":"BTC_USDT"}]
*/

// This source code is subject to the terms of the Mozilla Public License 2.0 at https://mozilla.org/MPL/2.0/
// © Coinrule

//@version=5
strategy("Ichimoku Cloud and Bollinger Bands",
         overlay=true,
         initial_capital=1000,
         process_orders_on_close=true,
         default_qty_type=strategy.percent_of_equity,
         default_qty_value=30,
         commission_type=strategy.commission.percent,
         commission_value=0.1)

showDate = input(defval=true, title='Show Date Range')
timePeriod = true
notInTrade = strategy.position_size <= 0


//Ichimoku Cloud
//Inputs
ts_bars = input.int(9, minval=1, title="Tenkan-Sen Bars")
ks_bars = input.int(26, minval=1, title="Kijun-Sen Bars")
ssb_bars = input.int(52, minval=1, title="Senkou-Span B Bars")
cs_offset = input.int(26, minval=1, title="Chikou-Span Offset")
ss_offset = input.int(26, minval=1, title="Senkou-Span Offset")
long_entry = input(true, title="Long Entry")
short_entry = input(true, title="Short Entry")

middle(len) => math.avg(ta.lowest(len), ta.highest(len))

// Components of Ichimoku Cloud
tenkan = middle(ts_bars)
kijun = middle(ks_bars)
senkouA = math.avg(tenkan, kijun)
senkouB = middle(ssb_bars)

// Plot Ichimoku Cloud
plot(tenkan, color=#0496ff, title="Tenkan-Sen")
plot(kijun, color=#991515, title="Kijun-Sen")
plot(close, offset=-cs_offset+1, color=#459915, title="Chikou-Span")
sa=plot(senkouA, offset=ss_offset-1, color=color.green, title="Senkou-Span A")
sb=plot(senkouB, offset=ss_offset-1, color=color.red, title="Senkou-Span B")
fill(sa, sb, color = senkouA > senkouB ? color.green : color.red, title="Cloud color")

ss_high = math.max(senkouA[ss_offset-1], senkouB[ss_offset-1])
ss_low = math.min(senkouA[ss_offset-1], senkouB[ss_offset-1])

// Entry/Exit Conditions
tk_cross_bull = tenkan > kijun
tk_cross_bear = tenkan < kijun
cs_cross_bull = ta.mom(close, cs_offset-1) > 0
cs_cross_bear = ta.mom(close, cs_offset-1) < 0
price_above_kumo = close > ss_high
price_below_kumo = close < ss_low


//Bollinger Bands Indicator
length = input.int(20, minval=1)
src = input(close, title="Source")
mult = input.float(2.0, minval=0.001, maxval=50, title="StdDev")
basis = ta.sma(src, length)
dev = mult * ta.stdev(src, length)
upper = basis + dev
lower = basis - dev
offset = input.int(0, "Offset", minval = -500, maxval = 500)
plot(basis, "Basis", color=#FF6D00, offset = offset)
p1 = plot(upper, "Upper", color=#2962FF, offset = offset)
p2 = plot(lower, "Lower", color=#2962FF, offset = offset)
fill(p1, p2, title = "Background", color=color.rgb(33, 150, 243, 95))

bullish = tk_cross_bull and cs_cross_bull and price_above_kumo and ta.crossover(lower, close)
bearish = tk_cross_bear and cs_cross_bear and price_below_kumo and ta.crossover(close, lower)

strategy.entry('Long', strategy.long, when=bullish and long_entry and timePeriod)
strategy.close('Long', when=bearish and not short_entry)

strategy.entry('Short', strategy.short, when=bearish and short_entry and timePeriod)
strategy.close('Short', when=bullish and not long_entry)


//Works well on BTC 30m/1h (11.29%), ETH 2h (29.05%), MATIC 2h/30m (37.12%), AVAX 1h/2h (49.2%), SOL 45m (45.43%)
Detail
https://www.fmz.com/strategy/436778
Last Modified
2023-12-27 16:21:28
