Name
Ichimoku云带量化交易策略Ichimoku-Cloud-Quantitative-Trading-Strategy
Author
ChaoZhang
Strategy Description
本策略综合运用一根曲线、日K线、Hull移动平均线、MACD指标等多个指标,构建长短多空决策机制,实现自动交易。
基于Ichimoku云带的转换线和延迟线构建多空交易信号。结合Hull移动平均线判断趋势方向。再利用MACD指标判断长短节奏。日内K线判断突破作为入场信号。
转换线是近9日的中价平均。延迟线是近26日的中价平均。当转换线上穿延迟线时,做多。当转换线下穿延迟线时,做空。
Hull移动平均线通过双平均线交叉来判断趋势,当快线上穿慢线时,判断为上升趋势;反之, dann判断为下降趋势。
MACD取12和26指数移动平均线差值,通过零轴和平均线的金叉死叉来判断多空。
日内K线突破延迟线作为入场时机。
- 综合多个指标,准确判断趋势方向。
- 选时精准,避免无谓交易。
- 风险控制到位,止损止盈机制。
- 参数设定不当可能导致过于激进入场。
- 多指标组合增加了策略复杂度。
- 短线操作难免出现回撤。
- 调整参数组合,适应更多品种和周期。
- 加入机器学习模块,实现参数自适应。
- 优化入场动量指标,提高胜率。
本策略结合Ichimoku云带等多个指标信号,搭建完整的量化决策体系。严格的止损止盈机制控制交易风险。通过参数调整和模型优化,可以适应更多交易品种,具有广阔的应用前景。
||
This strategy combines multiple indicators such as Ichimoku cloud, K-line, Hull Moving Average and MACD to build long and short decision mechanisms for automated trading.
It uses Ichimoku cloud conversion and lagging lines to generate trading signals. Hull Moving Average determines trend direction. MACD differentiates longer and shorter cycles. Intraday K-line breakout provides entry signals.
Conversion line averages mid price of last 9 days. Lagging line averages mid price of last 26 days. Long when conversion line crosses above lagging line, and short when crossing below.
Hull Moving Average uses double averaging lines crossover to define trends. Uptrend when fast line crosses above slow line, and downtrend in reverse.
MACD takes difference between 12- and 26-period EMAs. Crosses on zero line and signal line indicate long/short signals.
K-line penetration on lagging line provides entry timing.
- Accurate trend detection with multiple indicators.
- Precise entry avoiding unnecessary trades.
- Solid risk control with stop loss/take profit.
- Aggressive entry with improper parameter tuning.
- Increased complexity with multi-indicator usage.
- Drawdowns inevitable for short-term trades.
- Optimize parameters for more products and timeframes.
- Add machine learning for adaptive tuning.
- Improve entry momentum for higher win rate.
This strategy combines Ichimoku cloud and other indicator signals into a complete quantitative system. Strict stop loss/take profit mechanism controls risks. With parameter turning and model optimization, it can be applied to more trading instruments with broad prospects.
[/trans]
Strategy Arguments
| Argument | Default | Description |
|---|---|---|
| v_input_1 | 14 | Double HullMA |
| v_input_2 | 0.001 | Decision Threshold (0.001) |
| v_input_3 | -500 | Stop Loss in $ |
| v_input_4 | 25000 | Target Point in $ |
| v_input_5 | 9 | Conversion Line Periods |
| v_input_6 | 26 | Base Line Periods |
| v_input_7 | 52 | Lagging Span 2 Periods |
| v_input_8 | 26 | Displacement |
| v_input_9 | 9 | MACD_Length |
| v_input_10 | 12 | MACD_fastLength |
| v_input_11 | 26 | MACD_slowLength |
Source (PineScript)
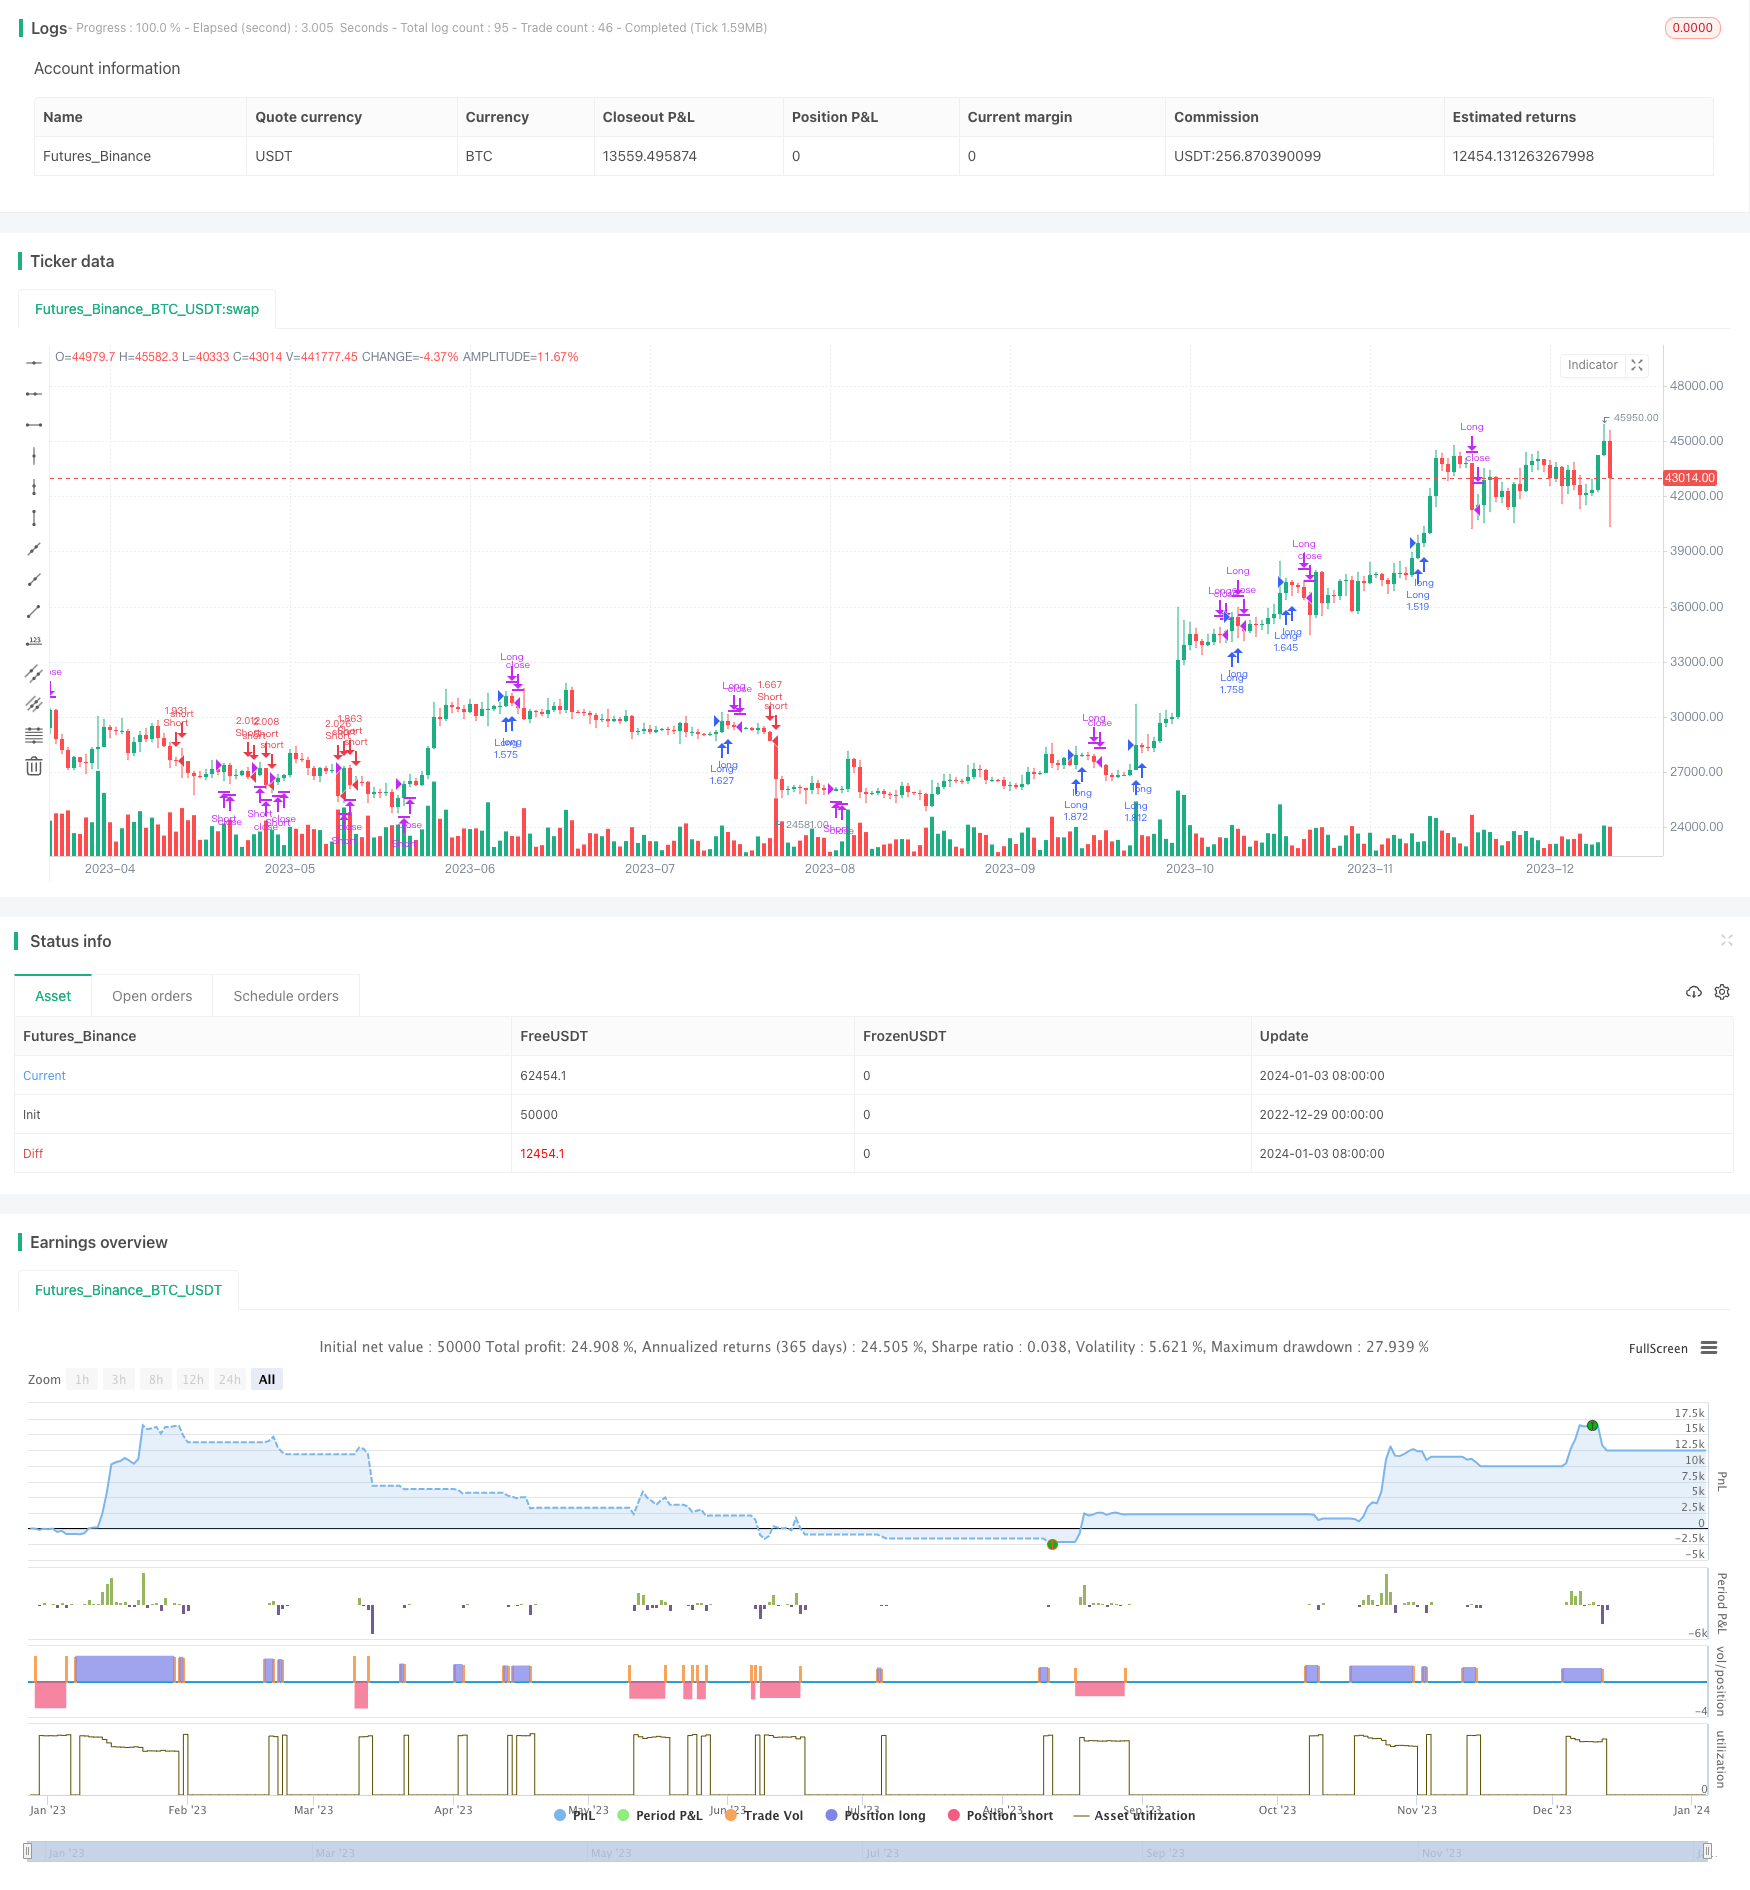
/*backtest
start: 2022-12-29 00:00:00
end: 2024-01-04 00:00:00
period: 1d
basePeriod: 1h
exchanges: [{"eid":"Futures_Binance","currency":"BTC_USDT"}]
*/

//@version=2
// Any timeFrame ok but good on 15 minute & 60 minute , Ichimoku + Daily-Candle_cross(DT) + HULL-MA_cross + MacD combination 420 special blend
strategy("Ichimoku + Daily-Candle_X + HULL-MA_X + MacD", shorttitle="٩(̾●̮̮̃̾•̃̾)۶", overlay=true, default_qty_type=strategy.percent_of_equity, max_bars_back=720, default_qty_value=100, calc_on_order_fills= true, calc_on_every_tick=true, pyramiding=0)
keh=input(title="Double HullMA",defval=14, minval=1)
dt = input(defval=0.0010, title="Decision Threshold (0.001)", type=float, step=0.0001)
SL = input(defval=-500.00, title="Stop Loss in $", type=float, step=1)
TP = input(defval=25000.00, title="Target Point in $", type=float, step=1)
ot=1
n2ma=2*wma(close,round(keh/2))
nma=wma(close,keh)
diff=n2ma-nma
sqn=round(sqrt(keh))
n2ma1=2*wma(close[1],round(keh/2))
nma1=wma(close[1],keh)
diff1=n2ma1-nma1
sqn1=round(sqrt(keh))
n1=wma(diff,sqn)
n2=wma(diff1,sqn)
b=n1>n2?lime:red
c=n1>n2?green:red
d=n1>n2?red:green
confidence=(request.security(syminfo.tickerid, 'D', close)-request.security(syminfo.tickerid, 'D', close[1]))/request.security(syminfo.tickerid, 'D', close[1])
conversionPeriods = input(9, minval=1, title="Conversion Line Periods")
basePeriods = input(26, minval=1, title="Base Line Periods")
laggingSpan2Periods = input(52, minval=1, title="Lagging Span 2 Periods")
displacement = input(26, minval=1, title="Displacement")
donchian(len) => avg(lowest(len), highest(len))
conversionLine = donchian(conversionPeriods)
baseLine = donchian(basePeriods)
leadLine1 = avg(conversionLine, baseLine)
leadLine2 = donchian(laggingSpan2Periods)
LS=close, offset = -displacement
MACD_Length = input(9)
MACD_fastLength = input(12)
MACD_slowLength = input(26)
MACD = ema(close, MACD_fastLength) - ema(close, MACD_slowLength)
aMACD = ema(MACD, MACD_Length)
closelong = n1<n2 and close<n2 and confidence<dt or strategy.openprofit<SL or strategy.openprofit>TP
if (closelong)
    strategy.close("Long")
closeshort = n1>n2 and close>n2 and confidence>dt or strategy.openprofit<SL or strategy.openprofit>TP
if (closeshort)
    strategy.close("Short")
longCondition = n1>n2 and strategy.opentrades<ot and confidence>dt and close>n2 and leadLine1>leadLine2 and open<LS and MACD>aMACD
if (longCondition)
    strategy.entry("Long",strategy.long)
shortCondition = n1<n2 and strategy.opentrades<ot and confidence<dt and close<n2 and leadLine1<leadLine2 and open>LS and MACD<aMACD
if (shortCondition)
    strategy.entry("Short",strategy.short)//                         /L'-,
//                               ,'-.           /MM . .             /  L '-,
//     .                    _,--dMMMM\         /MMM  `..           /       '-,
//     :             _,--,  )MMMMMMMMM),.      `QMM   ,<>         /_      '-,'
//     ;     ___,--. \MM(    `-'   )M//MM\       `  ,',.;      .-'* ;     .'
//     |     \MMMMMM) \MM\       ,dM//MMM/     ___ < ,; `.      )`--'    /
//     |      \MM()M   MMM)__   /MM(/MP'  ___, \  \ `  `. `.   /__,    ,'
//     |       MMMM/   MMMMMM( /MMMMP'__, \     | /      `. `-,_\     /
//     |       MM     /MMM---' `--'_ \     |-'  |/         `./ .\----.___
//     |      /MM'   `--' __,-  \""   |-'  |_,               `.__) . .F. )-.
//     |     `--'       \   \    |-'  |_,     _,-/            J . . . J-'-. `-.,
//     |         __  \`. |   |   |         \    / _           |. . . . \   `-.  F
//     |   ___  /  \  | `|   '      __  \   |  /-'            F . . . . \     '`
//     |   \  \ \  /  |        __  /  \  |  |,-'        __,- J . . . . . \
//     |    | /  |/     __,-  \  ) \  /  |_,-     __,--'     |. .__.----,'
//     |    |/    ___     \    |'.  |/      __,--'           `.-;;;;;;;;;\
//     |     ___  \  \     |   |  `   __,--'                  /;;;;;;;;;;;;.
//     |     \  \  |-'\    '    __,--'                       /;;;;;;;;;;;;;;\
// \   |      | /  |      __,--'                             `--;;/     \;-'\
//  \  |      |/    __,--'                                   /  /         \  \
//   \ |      __,--'                                        /  /           \  \
//    \|__,--'                                          _,-;M-K,           ,;-;\
//                                                     <;;;;;;;;           '-;;;;
//a1=plot(n1,color=c)
//a2=plot(n2,color=c)
//plot(cross(n1, n2) ? n1 : na, style = circles, color=b, linewidth = 4)
//plot(cross(n1, n2) ? n1 : na, style = line, color=d, linewidth = 4)
//plot(conversionLine, color=#0496ff, title="Conversion Line")
//plot(baseLine, color=#991515, title="Base Line")
//plot(close, offset = -displacement, color=#459915, title="Lagging Span")
//p1=plot (leadLine1, offset = displacement, color=green,  title="Lead 1")
//p2=plot (leadLine2, offset = displacement, color=red,  title="Lead 2")
//fill(p1, p2, color = leadLine1 > leadLine2 ? green : red)
// remove the "//" from before the plot script if want to see the indicators on chart
Detail
https://www.fmz.com/strategy/437763
Last Modified
2024-01-05 13:53:11