Name
MACD-EMA黄金交叉趋势追踪策略MACD-EMA-Crossover-Trend-Tracking-Strategy
Author
ChaoZhang
Strategy Description
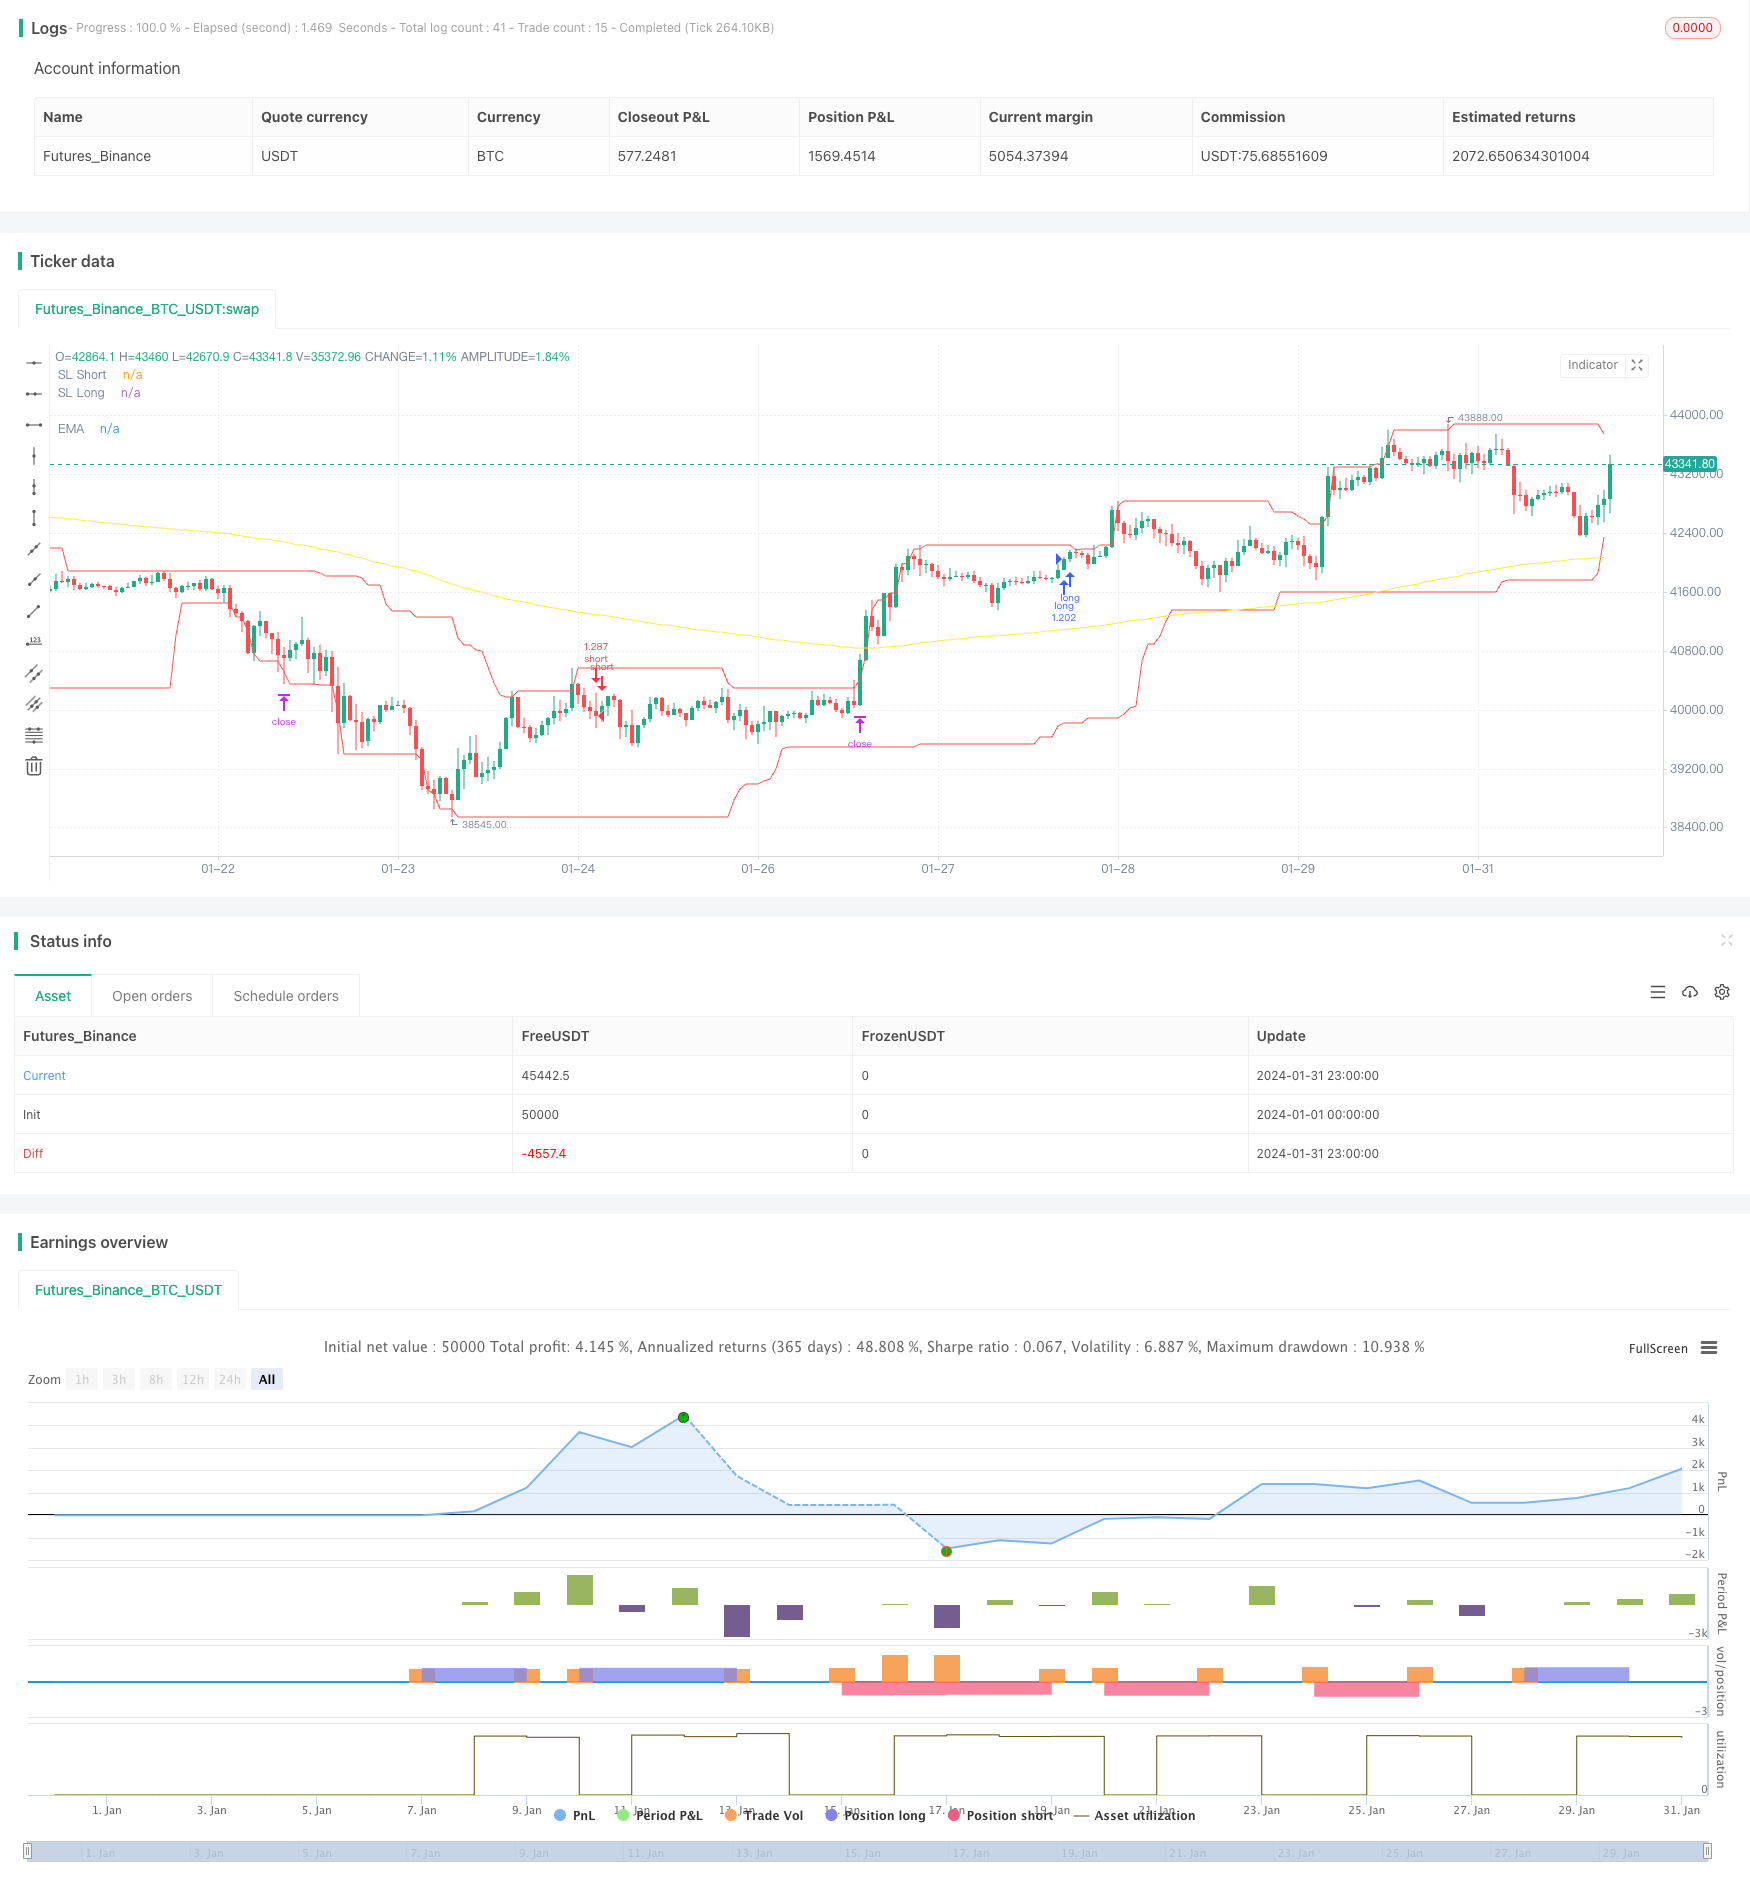
该策略通过计算MACD指标及其移动平均线信号线的交叉来确定趋势方向,并结合EMA指标判断当前趋势强弱,实现趋势追踪。当MACD线从下向上突破信号线时做多,从上向下突破做空,同时EMA线也可判断趋势强弱从而过滤假突破。
该策略主要基于MACD指标判断趋势方向和入场时机。MACD线突破信号线表明价格趋势发生反转,因此根据突破方向来判断做多做空。具体判断逻辑是,当收盘价高于EMA平均线,且MACD线从下方突破信号线时,做多;当收盘价低于EMA平均线,且MACD线从上方向下突破信号线时,做空。
EMA均线的作用是辅助判断趋势,如果价格高于EMA均线说明处于上涨趋势,此时MACD下方突破容易形成运行的黄金交叉信号;如果价格低于EMA均线说明处于下跌趋势,此时MACD上方突破容易形成死叉信号。EMA的长度也决定了判断趋势的中长期程度。
通过上述方式,可以在价格开始反转形成新趋势时及时进入场内,实现趋势追踪效果。
该策略结合双重判断条件,既考虑到价格的趋势方向,又利用指标判断具体的入场时机,避免假突破的风险,增强了策略的可靠性。相比单一采用MACD指标,该策略可以更准确判断新趋势的启动。
EMA均线的运用也使策略在一定程度上过滤掉短期波动的影响,锁定中长线趋势。这对于发挥MACD指标判断反转的效果很有帮助。
此外,策略同时设定做多和做空条件,可以适用于涨跌莲花的市场环境,这也增强了策略的适应性。
该策略主要风险在于MACD指标本身判断 Fakeout 的概率较大,信号可能会被错误识别。此时就需要EMA均线的辅助功能,但是在特殊行情中也有失效的可能。
此外,策略中采用了盈亏比例来设置止损止盈条件,这存在一定程度的主观性,如果设置不当也会影响策略效果。
最后,策略中简单设置了开仓数量为100%的账户权益,没有考虑资金管理问题,这在实盘中也存在一定的风险。
该策略主要有以下几个优化方向:
-
增加其他指标判断,形成多个指标组合,可以进一步避免MACD发出错误信号的概率。例如可以考虑KDJ、BOLL等。
-
EMA均线长度可以进行多组合优化,找到判断趋势方向最佳参数。
-
MACD参数也可以进行进一步优化,找到确定反转时机最准确的参数取值。
-
增加资金管理模块,例如盈亏比例可以作为动态输入,也可以设置滑点止损等。
-
测试不同品种合约的效果,寻找最匹配的交易品种。例如加密货币、股指期货等。
该MACD EMA黄金交叉趋势追踪策略整体来说较为简单实用,通过双重指标判断确保信号的可靠性,设置合理的止损止盈方式锁定利润。主要优化空间在参数选择、指标组合、资金管理等方面。如果进一步优化测试,相信该策略可以成为高效的趋势追踪策略之一。
||
This strategy determines the trend direction by calculating the crossover between the MACD indicator and its signal line moving average, and judges the strength of the current trend with the EMA indicator to track the trend. It goes long when the MACD line breaks through the signal line upward and goes short when breaking through downward. The EMA line can also judge the strength of the trend to filter out false breakouts.
The core of this strategy is to determine the trend direction and entry timing based on the MACD indicator. The crossover between the MACD line and the signal line indicates a reversal in the price trend. Therefore, long and short positions are determined according to the breakout direction. Specifically, when the closing price is above the EMA line and the MACD line breaks through the signal line from below, go long; when the closing price is below the EMA line and the MACD line breaks through the signal line from above, go short.
The EMA line serves to assist in judging the trend. If the price is above the EMA line, it indicates an upward trend. At this time, a breakthrough from the MACD below is likely to form a golden cross signal. If the price is below the EMA line, it indicates a downward trend. At this time, a breakthrough from above the MACD is likely to form a death cross signal. The EMA length also determines the mid-to-long term degree of the trend judgment.
In this way, we can enter the market in a timely manner when the price begins to reverse to form a new trend, achieving a trend tracking effect.
This strategy combines dual judgment conditions, taking into account both the trend direction of prices and using indicators to determine specific entry timing, avoiding the risk of false breakouts, and enhances the reliability of the strategy. Compared with using the MACD indicator alone, this strategy can more accurately determine the start of a new trend.
The application of the EMA line also enables the strategy to filter out the effects of short-term fluctuations and lock in medium and long term trends to some extent. This is very helpful for developing the effectiveness of the MACD indicator in judging reversal.
In addition, the strategy sets conditions for both long and short, which can be applied to bull and bear kite markets, thus enhancing the adaptability of the strategy.
The main risk of this strategy is that the MACD indicator itself has a high probability of misjudging Fakeout signals. At this point, the auxiliary function of the EMA line is needed, but failures can still happen in special market conditions.
In addition, the strategy adopts a profit factor to set stop loss and take profit conditions, which involves some subjectivity. Improper settings may also affect strategy performance.
Finally, the strategy simply sets the position size to 100% of the account's equity without considering the issue of fund management, which also poses some risks in live trading.
The main optimization directions for this strategy include:
-
Increase other indicators for judgment to form multiple indicator combinations to further avoid the probability of MACD generating wrong signals. For example, KDJ and BOLL can be considered.
-
The EMA line length can be multi-parameter optimized to find the optimal parameters for judging trend direction.
-
The MACD parameters can also be further optimized to find the most accurate values for determining reversal timing.
-
Add a capital management module. For example, the profit factor can be used as a dynamic input, and slippage stops can also be set.
-
Test the effects on different types of contracts, such as cryptocurrencies, index futures, etc. to find the most suitable trading variety.
Overall, this MACD EMA Crossover Trend Tracking strategy is relatively simple and practical. It ensures signal reliability through dual indicator conditions and locks in profits through reasonable stop loss and take profit methods. The main optimization space lies in parameter selection, indicator combinations, capital management, etc. With further optimization and testing, it is believed that this strategy can become one of the most efficient trend tracking strategies.
[/trans]
Strategy Arguments
| Argument | Default | Description |
|---|---|---|
| v_input_1 | true | FromMonth |
| v_input_2 | true | FromDay |
| v_input_3 | 2020 | FromYear |
| v_input_4 | true | ToMonth |
| v_input_5 | true | ToDay |
| v_input_6 | 9999 | ToYear |
| v_input_7 | 15 | EMA Timeframe |
| v_input_8 | 206 | EMA Length |
| v_input_9 | 15 | Fast Length |
| v_input_10 | 24 | Slow Length |
| v_input_11_close | 0 | Source: close |
| v_input_12 | 9 | Signal Smoothing |
| v_input_13 | true | Simple MA (Oscillator) |
| v_input_14 | true | Simple MA (Signal Line) |
| v_input_15 | true | Enable long? |
| v_input_16 | true | Enable short? |
| v_input_17 | 1.9 | ProfitfactorLong |
| v_input_18 | 46 | Lowest Low Lookback |
| v_input_19 | 2.1 | ProfitfactorShort |
| v_input_20 | 25 | highest high lookback |
Source (PineScript)
/*backtest
start: 2024-01-01 00:00:00
end: 2024-01-31 23:59:59
period: 1h
basePeriod: 15m
exchanges: [{"eid":"Futures_Binance","currency":"BTC_USDT"}]
*/

//@version=4

strategy(title="MACD EMA Strategy", shorttitle="MACD EMA STRAT", overlay = true, pyramiding = 0, max_bars_back=3000, calc_on_order_fills = false, commission_type =  strategy.commission.percent, commission_value = 0, default_qty_type = strategy.percent_of_equity, default_qty_value = 100, initial_capital=5000, currency=currency.USD)

// Time Range
FromMonth=input(defval=1,title="FromMonth",minval=1,maxval=12)
FromDay=input(defval=1,title="FromDay",minval=1,maxval=31)
FromYear=input(defval=2020,title="FromYear",minval=2016)
ToMonth=input(defval=1,title="ToMonth",minval=1,maxval=12)
ToDay=input(defval=1,title="ToDay",minval=1,maxval=31)
ToYear=input(defval=9999,title="ToYear",minval=2017)
start=timestamp(FromYear,FromMonth,FromDay,00,00)
finish=timestamp(ToYear,ToMonth,ToDay,23,59)
window()=>true

// STEP 2:
// See if this bar's time happened on/after start date
afterStartDate = true

//EMA
emasrc = close
res = input(title="EMA Timeframe", type=input.resolution, defval="15")
len1 = input(title="EMA Length", type=input.integer, defval=206)
col1 = color.yellow
// Calculate EMA
ema1 = ema(emasrc, len1)
emaSmooth = security(syminfo.tickerid, res, ema1, barmerge.gaps_on, barmerge.lookahead_off)
// Draw EMA
plot(emaSmooth, title="EMA", linewidth=1, color=col1)

//MACD
fast_length = input(title="Fast Length", type=input.integer, defval=15)
slow_length = input(title="Slow Length", type=input.integer, defval=24)
src = input(title="Source", type=input.source, defval=close)
signal_length = input(title="Signal Smoothing", type=input.integer, minval = 1, maxval = 50, defval = 9)
sma_source = input(title="Simple MA (Oscillator)", type=input.bool, defval=true)
sma_signal = input(title="Simple MA (Signal Line)", type=input.bool, defval=true)
zeroline = 0

// Plot colors
col_grow_above = #26A69A
col_grow_below = #FFCDD2
col_fall_above = #B2DFDB
col_fall_below = #EF5350
col_macd = #0094ff
col_signal = #ff6a00

// Calculating
fast_ma = sma_source ? sma(src, fast_length) : ema(src, fast_length)
slow_ma = sma_source ? sma(src, slow_length) : ema(src, slow_length)
macd = fast_ma - slow_ma
signal = sma_signal ? sma(macd, signal_length) : ema(macd, signal_length)
hist = macd - signal
//plot(hist, title="Histogram", style=plot.style_columns, color=(hist>=0 ? (hist[1] < hist ? col_grow_above : col_fall_above) : (hist[1] < hist ? col_grow_below : col_fall_below) ), transp=0 )
//plot(macd, title="MACD", color=col_macd, transp=0)
//plot(signal, title="Signal", color=col_signal, transp=0)
//plot(zeroline, title="Zero Line", color=color.black, transp=0)

///////////////////////////LONG////////////////////////////////////////////////////////////////////

enablelong = input(true, title="Enable long?")

//Long Signal
upcondition = close > emaSmooth and close[1] > emaSmooth[1]
macdunderhis = macd < zeroline
macdcrossup = crossover(macd, signal)

longcondition = upcondition and macdunderhis and macdcrossup

//strategy buy long
if (longcondition) and (afterStartDate) and strategy.opentrades < 1 and (enablelong == true)
    strategy.entry("long", strategy.long)

//////////////////////////////////////SHORT//////////////////////////////////////////////////////////////////////////////////

enableshort = input(true, title="Enable short?")

//Short Signal
downcondition = close < emaSmooth and close[1] < emaSmooth[1]
macdoverhis = macd > zeroline
macdcrosunder = crossunder(macd, signal)

shortcondition = downcondition and macdoverhis and macdcrosunder

//strategy buy short
if (shortcondition) and (afterStartDate) and strategy.opentrades < 1 and (enableshort == true)
    strategy.entry("short", strategy.short)


//////////////////////////////////////EXIT CONDITION//////////////////////////////////////////////////////////////////////////////////
bought = strategy.position_size[1] < strategy.position_size
sold = strategy.position_size[1] > strategy.position_size
barsbought = barssince(bought)
barssold = barssince(sold)
//////LOWEST LOW//////
//Lowest Low LONG
profitfactorlong = input(title="ProfitfactorLong", type=input.float, step=0.1, defval=1.9)
loLen = input(title="Lowest Low Lookback", type=input.integer,
  defval=46, minval=2)
stop_level_long = lowest(low, loLen)[1]

if strategy.position_size>0
    profit_level_long = strategy.position_avg_price + ((strategy.position_avg_price - stop_level_long[barsbought])*profitfactorlong)
    strategy.exit(id="TP/ SL", stop=stop_level_long[barsbought], limit=profit_level_long)

//Lowest Low SHORT
profitfactorshort = input(title="ProfitfactorShort", type=input.float, step=0.1, defval=2.1)
highLen = input(title="highest high lookback", type=input.integer,
  defval=25, minval=2)
stop_level_short = highest(high, highLen)[1]

if strategy.position_size<0
    profit_level_short = strategy.position_avg_price - ((stop_level_short[barssold] - strategy.position_avg_price)*profitfactorshort)
    strategy.exit(id="TP/ SL", stop=stop_level_short[barssold], limit=profit_level_short)

//PLOTT TP SL
plot(stop_level_long, title="SL Long", linewidth=1, color=color.red)
plot(stop_level_short, title="SL Short", linewidth=1, color=color.red)
Detail
https://www.fmz.com/strategy/442000
Last Modified
2024-02-18 15:17:36