Name
PPO价格敏感性动量双底定向交易策略PPO-Price-Sensitivity-Momentum-Double-Bottom-Directional-Trading-Strategy
Author
ChaoZhang
Strategy Description
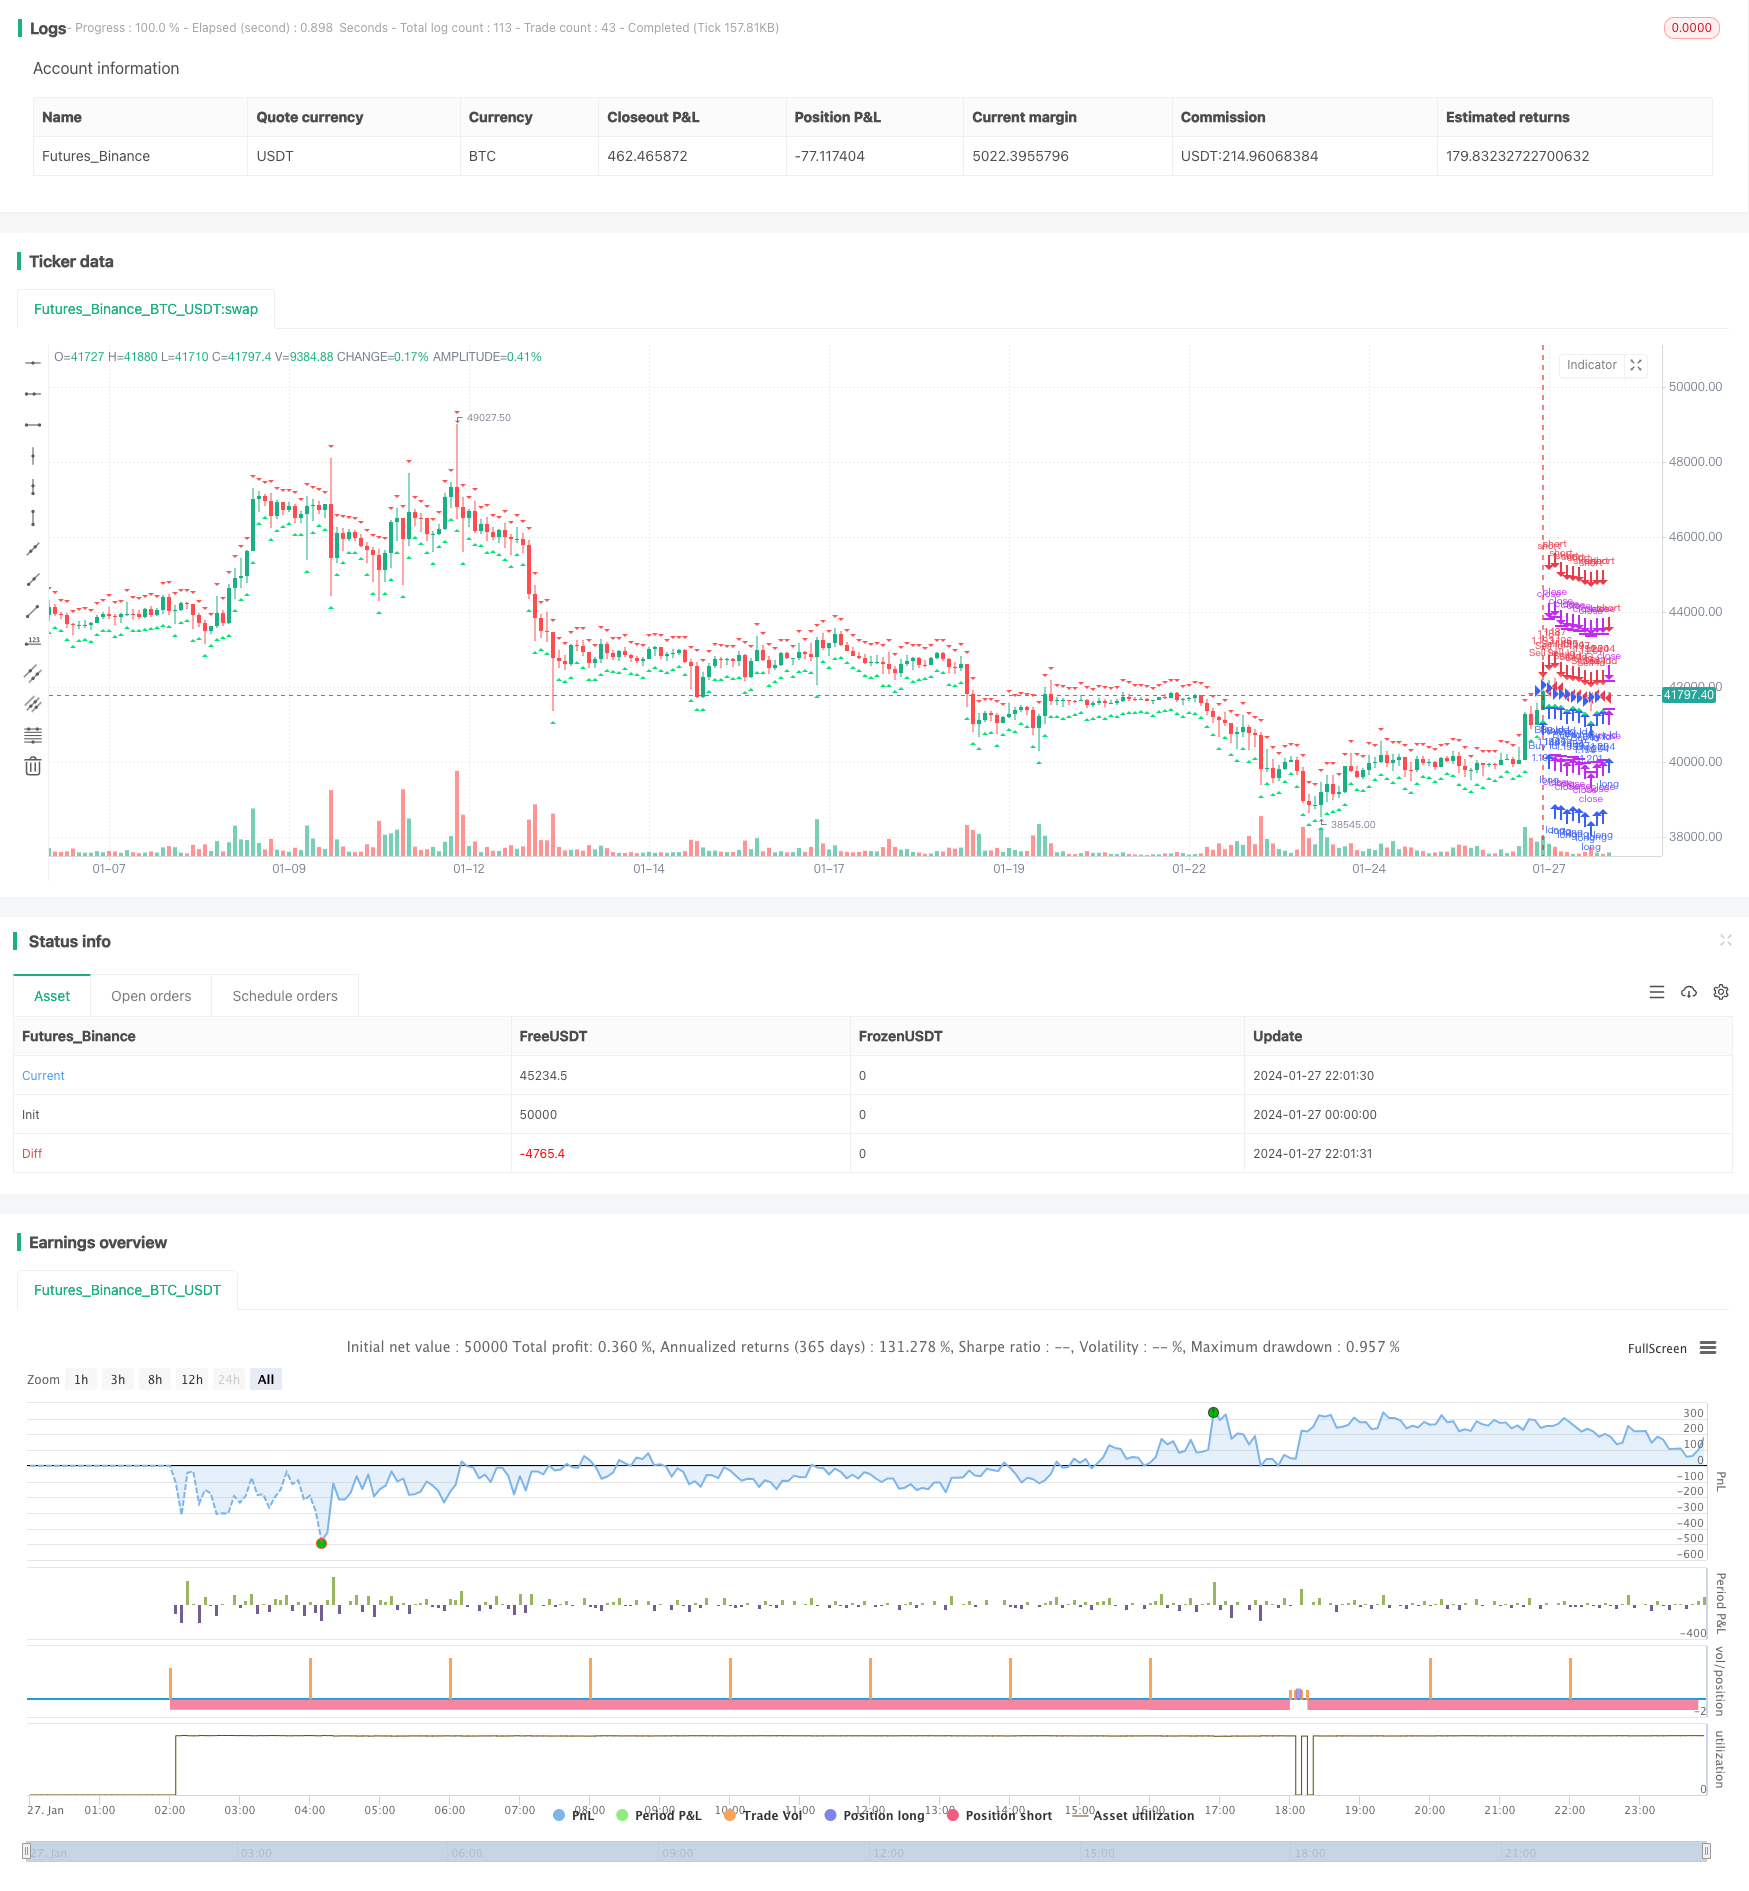
PPO价格敏感性动量双底定向交易策略是一种利用价格敏感性动量指标识别价格双底形成的趋势追踪交易策略。它结合了PPO指标的双底形成判断和价格动量特征判断,实现了对价格双底反转点的精确定位,从而产生交易信号。
该策略运用PPO指标判断价格双底特征,同时结合价格的最低点判定,实时监测PPO指标是否出现底部特征。当PPO指标出现由下向上反转的双底形态,表明当前处于买入机会点。
另一方面,该策略配合价格最小值判定,判断价格是否处于较低水平。当价格处于低位时,若PPO指标出现底部特征,则产生买入信号。
通过PPO指标反转特征判断和价格位置确认的双重判定,可有效识别价格反转机会,过滤掉一些假信号,提高信号的质量。
-
利用PPO指标的双底形态,可准确定位买入时机点。
-
结合价格位置判定,可过滤掉较高点产生的假信号,提高信号质量。
-
PPO指标敏感,可快速捕捉价格变化趋势,适合趋势追踪。
-
采用双重确认机制,可有效减少交易风险。
-
PPO指标容易产生假信号,需辅以其他指标进行确认。可加入均线指标或波动指标进行辅助。
-
双底反转不一定持续,存在再次下跌风险。可设置止损点,优化仓位管理。
-
参数设置不当可能导致漏损或错买风险。需对参数组合进行反复测试优化。
-
代码量较大,可继续模块化,减少重复代码。
-
增加止损模块,优化仓位管理策略。
-
加入均线指标或波动指标辅助确认。
-
模块化代码,减少重复判断逻辑。
-
继续优化参数,提高稳定性。
-
测试更多品种套利应用。
PPO价格敏感性动量双底定向交易策略通过捕捉PPO指标双底特征,结合价格位置判定的双重确认,实现了对价格反转点的有效定位。相比单一指标判断,具有判断更准确、过滤噪声更出色的优势。但该策略也存在一定的假信号风险,需要继续优化指标组合,并辅以严格的仓位管理策略,方可在实盘中稳定获利。
||
The PPO Price Sensitivity Momentum Double Bottom Directional Trading Strategy is a trend following trading strategy that utilizes the identification of price double bottom formations by the PPO (Percentage Price Oscillator) indicator to generate trade signals. It combines PPO's double bottom pattern recognition and price momentum characteristics to achieve precise positioning of price double bottom reversal points.
The strategy employs PPO indicator to determine price double bottom features, while incorporating price minimum point judgement to monitor PPO indicator's bottoming formation in real time. When PPO forms an upward reversal double bottom, it signals a current buying opportunity.
On the other hand, the strategy collaborates with price minimum value determination to ascertain if price resides at relatively low levels. If price stays low while PPO exhibits bottoming pattern, a buy signal is triggered.
Through PPO reversal characteristic validation and price level confirmation dual mechanism, potential price reversal chances can be identified effectively, filtering out false signals and improving signal quality.
-
PPO double bottom pattern enables accurate timing at entry points.
-
Combining price level confirmation filters out false signals occurring at relatively high levels, improving signal quality.
-
PPO is sensitive and swiftly captures price trend changes, suitable for trend tracking.
-
Dual confirmation mechanism effectively mitigates trading risk.
-
PPO tends to produce false signals, requiring confirmation from other indicators. Moving average or volatility indicators can assist confirmation.
-
Double bottom reversal may not sustain, facing risks of further decline. Stop loss can be set along with position sizing optimization.
-
Inappropriate parameter configuration leads to missed profit or wrong entries. Repeated backtests and optimization on parameter combination is necessary.
-
There is substantial code volume with replications. Further modularization helps reduce duplicated codes.
-
Incorporate stop loss module and optimize position sizing strategies.
-
Introduce moving average or volatility indicators as confirmation tools.
-
Modularize codes to avoid redundant logic judgements.
-
Continue parameter tuning to enhance stability.
-
Test spread trading applications across more products.
The PPO Price Sensitivity Momentum Double Bottom Directional Trading Strategy captures PPO indicator's double bottom features coupled with dual confirmation of price level positioning to effectively spot price reversal points. Compared to single indicator judgement, it possesses advantages of improved accuracy and capability to filter out noises. Nonetheless, certain risks of false signals remain, requiring further optimization on indicator combinations and strict position sizing tactics before stable profitability can be achieved in live trading.
[/trans]
Strategy Arguments
| Argument | Default | Description |
|---|---|---|
| v_input_1 | 2019 | Backtest Start Year |
| v_input_2 | true | Backtest Start Month |
| v_input_3 | true | Backtest Start Day |
| v_input_4 | 2999 | Backtest End Year |
| v_input_5 | true | Backtest End Month |
| v_input_6 | true | Backtest End Day |
| v_input_7 | true | Show PPO high/low triangles? |
| v_input_8 | true | Use long term divergences? |
| v_input_9 | 55 | Lookback Period |
| v_input_10 | 12 | PPO Fast |
| v_input_11 | 26 | PPO Slow |
| v_input_12 | 9 | PPO Signal |
| v_input_13 | 2 | PPO Smooth |
Source (PineScript)
/*backtest
start: 2024-01-27 00:00:00
end: 2024-01-28 00:00:00
period: 2h
basePeriod: 15m
exchanges: [{"eid":"Futures_Binance","currency":"BTC_USDT"}]
*/

// This source code is subject to the terms of the Mozilla Public License 2.0 at https://mozilla.org/MPL/2.0/
// © luciancapdefier

//@version=4
strategy("PPO Divergence ST", overlay=true, initial_capital=30000, calc_on_order_fills=true, default_qty_type=strategy.percent_of_equity, default_qty_value=100)

// time
FromYear = input(2019, "Backtest Start Year")
FromMonth = input(1, "Backtest Start Month")
FromDay = input(1, "Backtest Start Day")
ToYear = input(2999, "Backtest End Year")
ToMonth = input(1, "Backtest End Month")
ToDay = input(1, "Backtest End Day")
start = timestamp(FromYear, FromMonth, FromDay, 00, 00)  // backtest start window
finish = timestamp(ToYear, ToMonth, ToDay, 23, 59)        // backtest finish window
window() => time >= start and time <= finish ? true : false

source = close
topbots = input(true, title="Show PPO high/low triangles?")
long_term_div = input(true, title="Use long term divergences?")
div_lookback_period = input(55, minval=1, title="Lookback Period")
fastLength = input(12, minval=1, title="PPO Fast")
slowLength=input(26, minval=1, title="PPO Slow")
signalLength=input(9,minval=1, title="PPO Signal")
smoother = input(2,minval=1, title="PPO Smooth")
fastMA = ema(source, fastLength)
slowMA = ema(source, slowLength)
macd = fastMA - slowMA
macd2=(macd/slowMA)*100
d = sma(macd2, smoother) // smoothing PPO

bullishPrice = low

priceMins = bullishPrice > bullishPrice[1] and bullishPrice[1] < bullishPrice[2] or low[1] == low[2] and low[1] < low and low[1] < low[3] or low[1] == low[2] and low[1] == low[3] and low[1] < low and low[1] < low[4] or low[1] == low[2] and low[1] == low[3] and low[1] and low[1] == low[4] and low[1] < low and low[1] < low[5] // this line identifies bottoms and plateaus in the price
oscMins= d > d[1] and d[1] < d[2] // this line identifies bottoms in the PPO

BottomPointsInPPO = oscMins

bearishPrice = high
priceMax = bearishPrice < bearishPrice[1] and bearishPrice[1] > bearishPrice[2] or high[1] == high[2] and high[1] > high and high[1] > high[3] or high[1] == high[2] and high[1] == high[3] and high[1] > high and high[1] > high[4] or high[1] == high[2] and high[1] == high[3] and high[1] and high[1] == high[4] and high[1] > high and high[1] > high[5]  // this line identifies tops in the price
oscMax = d < d[1] and d[1] > d[2]   // this line identifies tops in the PPO

TopPointsInPPO = oscMax

currenttrough4=valuewhen (oscMins, d[1], 0) // identifies the value of PPO at the most recent BOTTOM in the PPO
lasttrough4=valuewhen (oscMins, d[1], 1) // NOT USED identifies the value of PPO at the second most recent BOTTOM in the PPO
currenttrough5=valuewhen (oscMax, d[1], 0) // identifies the value of PPO at the most recent TOP in the PPO
lasttrough5=valuewhen (oscMax, d[1], 1) // NOT USED identifies the value of PPO at the second most recent TOP in the PPO

currenttrough6=valuewhen (priceMins, low[1], 0) // this line identifies the low (price) at the most recent bottom in the Price
lasttrough6=valuewhen (priceMins, low[1], 1) // NOT USED this line identifies the low (price) at the second most recent bottom in the Price
currenttrough7=valuewhen (priceMax, high[1], 0) // this line identifies the high (price) at the most recent top in the Price
lasttrough7=valuewhen (priceMax, high[1], 1) // NOT USED this line identifies the high (price) at the second most recent top in the Price

delayedlow = priceMins and barssince(oscMins) < 3 ? low[1] : na
delayedhigh = priceMax and barssince(oscMax) < 3 ? high[1] : na

// only take tops/bottoms in price when tops/bottoms are less than 5 bars away
filter = barssince(priceMins) < 5 ? lowest(currenttrough6, 4) : na
filter2 = barssince(priceMax) < 5 ? highest(currenttrough7, 4) : na

//delayedbottom/top when oscillator bottom/top is earlier than price bottom/top
y11 = valuewhen(oscMins, delayedlow, 0)
y12 = valuewhen(oscMax, delayedhigh, 0)

// only take tops/bottoms in price when tops/bottoms are less than 5 bars away, since 2nd most recent top/bottom in osc
y2=valuewhen(oscMax, filter2, 1) // identifies the highest high in the tops of price with 5 bar lookback period SINCE the SECOND most recent top in PPO
y6=valuewhen(oscMins, filter, 1) // identifies the lowest low in the bottoms of price with 5 bar lookback period SINCE the SECOND most recent bottom in PPO

long_term_bull_filt = valuewhen(priceMins, lowest(div_lookback_period), 1)
long_term_bear_filt = valuewhen(priceMax, highest(div_lookback_period), 1)

y3=valuewhen(oscMax, currenttrough5, 0) // identifies the value of PPO in the most recent top of PPO
y4=valuewhen(oscMax, currenttrough5, 1) // identifies the value of PPO in the second most recent top of PPO

y7=valuewhen(oscMins, currenttrough4, 0) // identifies the value of PPO in the most recent bottom of PPO
y8=valuewhen(oscMins, currenttrough4, 1) // identifies the value of PPO in the SECOND most recent bottom of PPO

y9=valuewhen(oscMins, currenttrough6, 0)
y10=valuewhen(oscMax, currenttrough7, 0)

bulldiv= BottomPointsInPPO ? d[1] : na // plots dots at bottoms in the PPO
beardiv= TopPointsInPPO ? d[1]: na // plots dots at tops in the PPO

i = currenttrough5 < highest(d, div_lookback_period) // long term bearish oscilator divergence
i2 = y10 > long_term_bear_filt // long term bearish top divergence
i3 = delayedhigh > long_term_bear_filt // long term bearish delayedhigh divergence

i4 = currenttrough4 > lowest(d, div_lookback_period) // long term bullish osc divergence
i5 = y9 < long_term_bull_filt // long term bullish bottom div
i6 = delayedlow < long_term_bull_filt // long term bullish delayedbottom div

//plot(0, color=gray)
//plot(d, color=black)
//plot(bulldiv, title = "Bottoms", color=maroon, style=circles, linewidth=3, offset= -1)
//plot(beardiv, title = "Tops", color=green, style=circles, linewidth=3, offset= -1)

bearishdiv1 = (y10 > y2 and oscMax and y3 < y4) ? true : false
bearishdiv2 = (delayedhigh > y2 and y3 < y4) ? true : false
bearishdiv3 = (long_term_div and oscMax and i and i2) ? true : false
bearishdiv4 = (long_term_div and i and i3) ? true : false

bullishdiv1 = (y9 < y6 and oscMins and y7 > y8) ? true : false
bullishdiv2 = (delayedlow < y6 and y7 > y8) ? true : false
bullishdiv3 = (long_term_div and oscMins and i4 and i5) ? true : false
bullishdiv4 = (long_term_div and i4 and i6) ? true : false

bearish = bearishdiv1 or bearishdiv2 or bearishdiv3 or bearishdiv4
bullish = bullishdiv1 or bullishdiv2 or bullishdiv3 or bullishdiv4

greendot = beardiv != 0 ? true : false
reddot = bulldiv != 0 ? true : false

if (reddot and window())
    strategy.entry("Buy Id", strategy.long, comment="BUY")

if (greendot and window())
    strategy.entry("Sell Id", strategy.short, comment="SELL")

alertcondition( bearish, title="Bearish Signal (Orange)", message="Orange & Bearish: Short " )
alertcondition( bullish, title="Bullish Signal (Purple)", message="Purple & Bullish: Long " )
alertcondition( greendot, title="PPO High (Green)", message="Green High Point: Short " )
alertcondition( reddot, title="PPO Low (Red)", message="Red Low Point: Long " )

// plotshape(bearish ? d : na, text='▼\nP', style=shape.labeldown, location=location.abovebar, color=color(orange,0), textcolor=color(white,0), offset=0)
// plotshape(bullish ? d : na, text='P\n▲', style=shape.labelup, location=location.belowbar, color=color(#C752FF,0), textcolor=color(white,0), offset=0)
plotshape(topbots and greendot ? d : na, text='', style=shape.triangledown, location=location.abovebar, color=color.red, offset=0, size=size.tiny)
plotshape(topbots and reddot ? d : na, text='', style=shape.triangleup, location=location.belowbar, color=color.lime, offset=0, size=size.tiny)

//barcolor(bearishdiv1 or bearishdiv2 or bearishdiv3 or bearishdiv4 ? orange : na)
//barcolor(bullishdiv1 or bullishdiv2 or bullishdiv3 or bullishdiv4 ? fuchsia : na)
//barcolor(#dedcdc)
Detail
https://www.fmz.com/strategy/440316
Last Modified
2024-01-29 11:38:42