Name
RSI与布林带结合的短线交易策略RSI-Bollinger-Bands-Short-term-Trading-Strategy
Author
ChaoZhang
Strategy Description
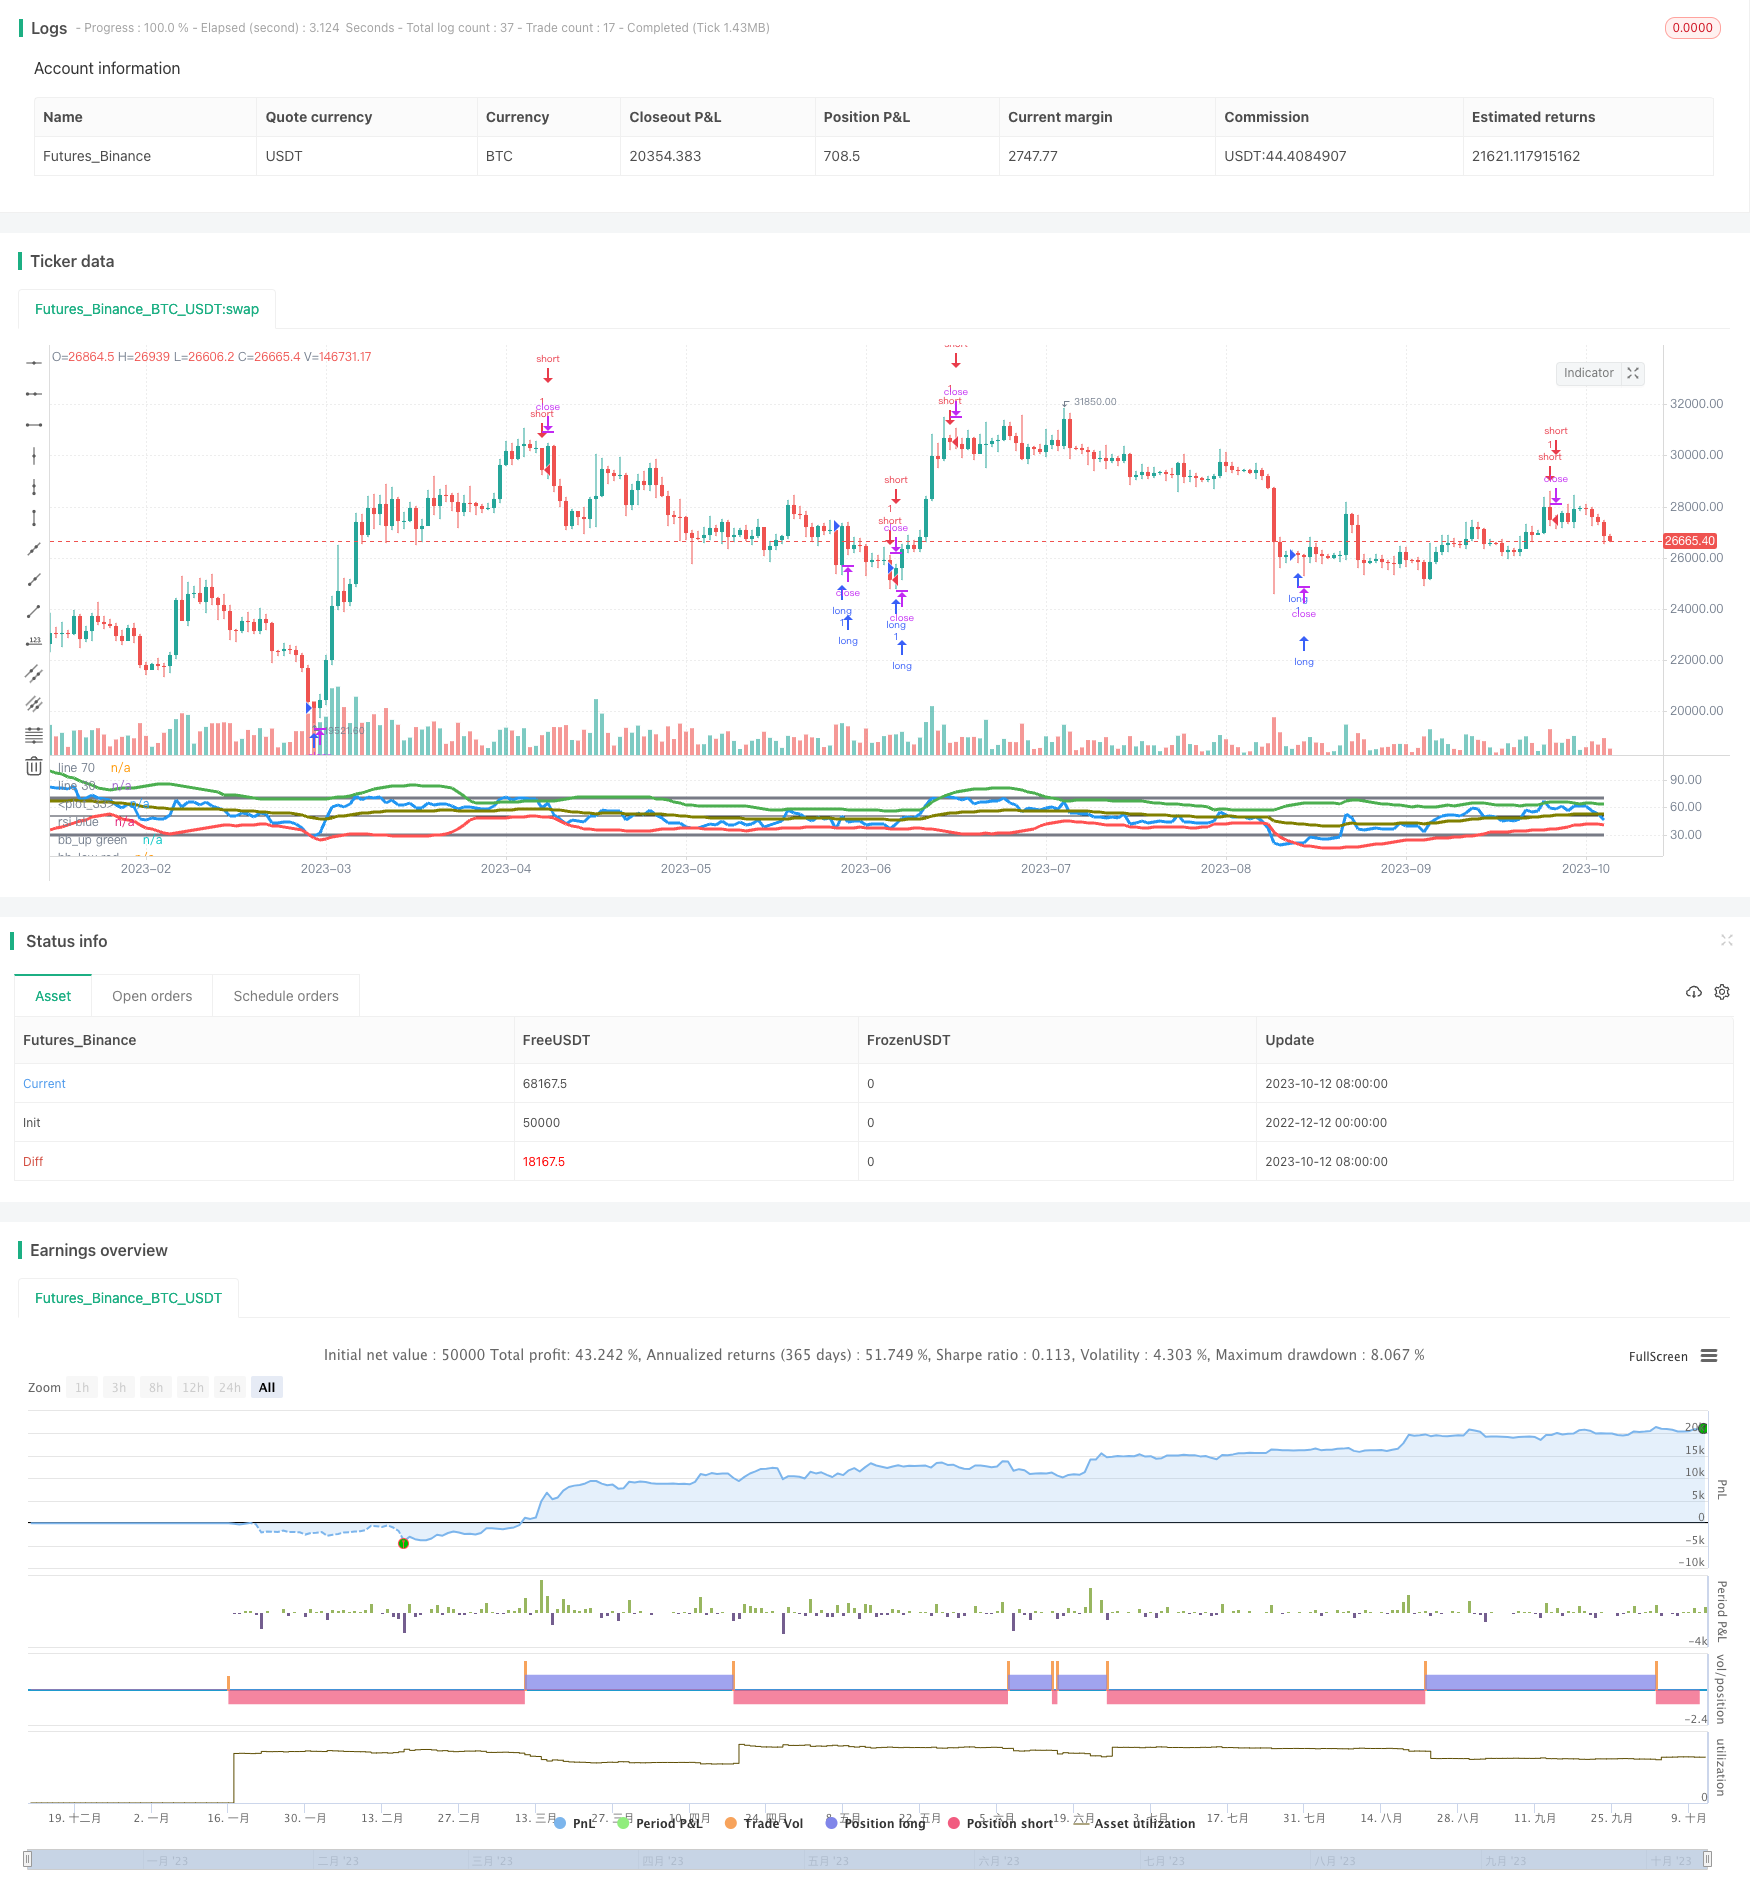
本策略结合相对强弱指标(RSI)和布林带,构建一个短线交易策略。该策略主要利用RSI指标突破布林带上下轨的时候,进行买卖操作。同时,策略还包含止损机制,可以有效控制风险。
- 计算RSI指标值,参数设置为14周期。
- 计算布林带中线,这里采用RSI的加权移动平均,周期设置为25。
- 计算布林带上轨和下轨,上轨为中线加幅度,下轨为中线减幅度,幅度设置为RSI标准差的20倍。
- 当RSI上穿下轨时,做多;当RSI下穿上轨时,做空。
- 设置止损机制,如果做多之后,价格跌破买入价格的6%,则止损。
这种策略结合RSI指标和布林带,能够有效利用二者的优势,进行短线交易。主要优势如下:
- RSI能够有效判断市场的超买超卖现象。结合布林带上下轨,能够提高信号的准确性。
- 布林带上下轨Dynamic,能够根据市场波动程度,自动调整范围。
- 止损机制设置合理,6%的止损幅度,既能够容忍正常波动,又能够有效控制损失。
该策略也存在一定的风险,主要体现在:
- RSI指标存在滞后性,可能错过快速反转的机会。
- 布林带参数设置不当,或者市场出现剧烈波动,也会导致信号错误。
- 止损位置设置不合理,可能过于宽泛或者过于激进,增加了不必要的损失。
对策与解决方法:
- 可以考虑结合其他指标,如KDJ等,综合判断市场情况。
- 动态优化布林带参数,根据不同市场调整参数。
- 测试和优化止损位置,设置最佳的参数。
本策略还具有进一步优化的空间:
- 可以考虑将止损从固定幅度,调整为带动态追踪的止损。这样可以根据价格波动情况,灵活调整止损位置。
- 可以在布林带的基础上,加入布林带宽度指数(BBW)的判断规则。当布林带过于扩张或收缩时,可以暂停交易,避免错误信号。
- 可以结合交易量的指标,如能量潮,增加量价确认的条件。这样可以进一步避免假突破。
本策略整体来说是一种较为稳定可靠的短线交易策略。它结合RSI指标判断超买超卖的优势,以及布林带自动追踪波动范围的特性,形成一个具有一定优势的短线策略。在参数优化和规则优化后,该策略可以获得较为稳定的收益。
||
This strategy combines the Relative Strength Index (RSI) and Bollinger Bands to construct a short-term trading strategy. It mainly utilizes the buy and sell signals when RSI breaks through the upper or lower Bollinger Bands. Meanwhile, a stop loss mechanism is included to effectively control risks.
- Calculate the RSI indicator with a 14-period parameter.
- Calculate the Bollinger Midband using the weighted moving average of RSI, with a period set to 25.
- Calculate the Upper Band and Lower Band of Bollinger Bands. The Upper Band is the Midband plus the amplitude, while the Lower Band is the Midband minus the amplitude. The amplitude is set to 20 times the RSI standard deviation.
- Go long when RSI breaks through the Lower Band, and go short when RSI breaks through the Upper Band.
- Set a stop loss mechanism that if the price drops below 6% of the long entry price, close the long position.
This strategy combines the strengths of both RSI and Bollinger Bands for short-term trading. The main advantages are:
- RSI can effectively determine overbought and oversold scenarios. Combining Bollinger Bands adds accuracy to the trading signals.
- Bollinger Bands are dynamic to automatically adjust the range based on market volatility.
- The stop loss setting is reasonable with 6% tolerance for normal fluctuations while controlling losses.
Potential risks of this strategy includes:
- RSI has lagging characteristics and may miss fast reversal opportunities.
- Incorrect Bollinger Bands parameter or drastic market swings can cause bad signals.
- Stop loss parameter set unwisely may lead to unnecessary losses.
Solutions:
- Consider combining with other indicators like KDJ for comprehensive judgment.
- Dynamically optimize parameters for different markets.
- Backtest and optimize stop loss parameter for best setting.
There is room for further optimization:
- Change fixed stop loss to dynamic trailing stop loss according to price fluctuation.
- Add Bollinger Band Width Index rules to pause trading when Bands expand or contract too much.
- Combine volume indicators like Chaikin Money Flow for better confirmation.
In summary, this is a relatively stable and reliable short-term trading strategy. By combining the strengths of overbought-oversold judgment of RSI and the adaptive range of Bollinger Bands, it forms an advantageous short-term system. With parameter tuning and logic refinement, this strategy can achieve consistent profits.
[/trans]
Strategy Arguments
| Argument | Default | Description |
|---|---|---|
| v_input_1 | 14 | len_rsi |
| v_input_2 | 25 | len_bb |
| v_input_3 | 20 | mul10 |
| v_input_4 | 94 | stop loss rate |
Source (PineScript)
/*backtest
start: 2022-12-12 00:00:00
end: 2023-10-13 00:00:00
period: 1d
basePeriod: 1h
exchanges: [{"eid":"Futures_Binance","currency":"BTC_USDT"}]
*/

//@version=3
strategy("rsi+bb st", shorttitle="rsibb st 0.3")

len_rsi=input(14)
len_bb = input(25)
mul10 = input(20.0)
mul=mul10/10
sl100 = input(94.0, title='stop loss rate')
sl=sl100/100

lw = 3

vwma_e(src, len) =>
    ema(src*volume, len)/ema(volume,len)

rsi = rsi(close, len_rsi)
plot(rsi, color=blue, title= 'rsi blue', linewidth=lw)
plot(70, color=gray, title='line 70', linewidth=lw)
plot(30, color=gray, title='line 30', linewidth=lw)

bbg = stdev(rsi, len_bb)*mul
bbc = vwma_e(rsi, len_bb)
//bbc=ema(rsi,len_bb)
ratio = 0.6
bbc := bbc*ratio + 50*(1-ratio)

bbu = bbc+bbg
bbl = bbc-bbg
plot(bbu, color=green, title='bb_up green', linewidth=lw)
plot(bbl, color=red, title='bb_low red', linewidth=lw)
plot(bbc, color=#808000ff, title='bb center', linewidth=lw)

plot(50, color=black)

lc = crossover(rsi, bbl) //or crossover(rsi, bbc)
sc = crossunder(rsi, bbu)

last_pos = 0*close
if lc
    last_pos := 1
else
    last_pos := last_pos[1]
if sc
    last_pos := 2

last_price = 0*close
if last_pos[1] !=1 and last_pos == 1
    last_price := close
else
    last_price := last_price[1]

if last_pos==1 and close < last_price*sl
    lc:=false
    sc:=true
    last_pos:=2

if (lc)
    strategy.entry("long", strategy.long)

if (sc)
    strategy.entry("short", strategy.short)
Detail
https://www.fmz.com/strategy/435843
Last Modified
2023-12-19 11:31:09