Name
RSI与布林带融合的LTC交易策略RSI-and-Bollinger-Bands-Fusion-Trading-Strategy-for-LTC
Author
ChaoZhang
Strategy Description
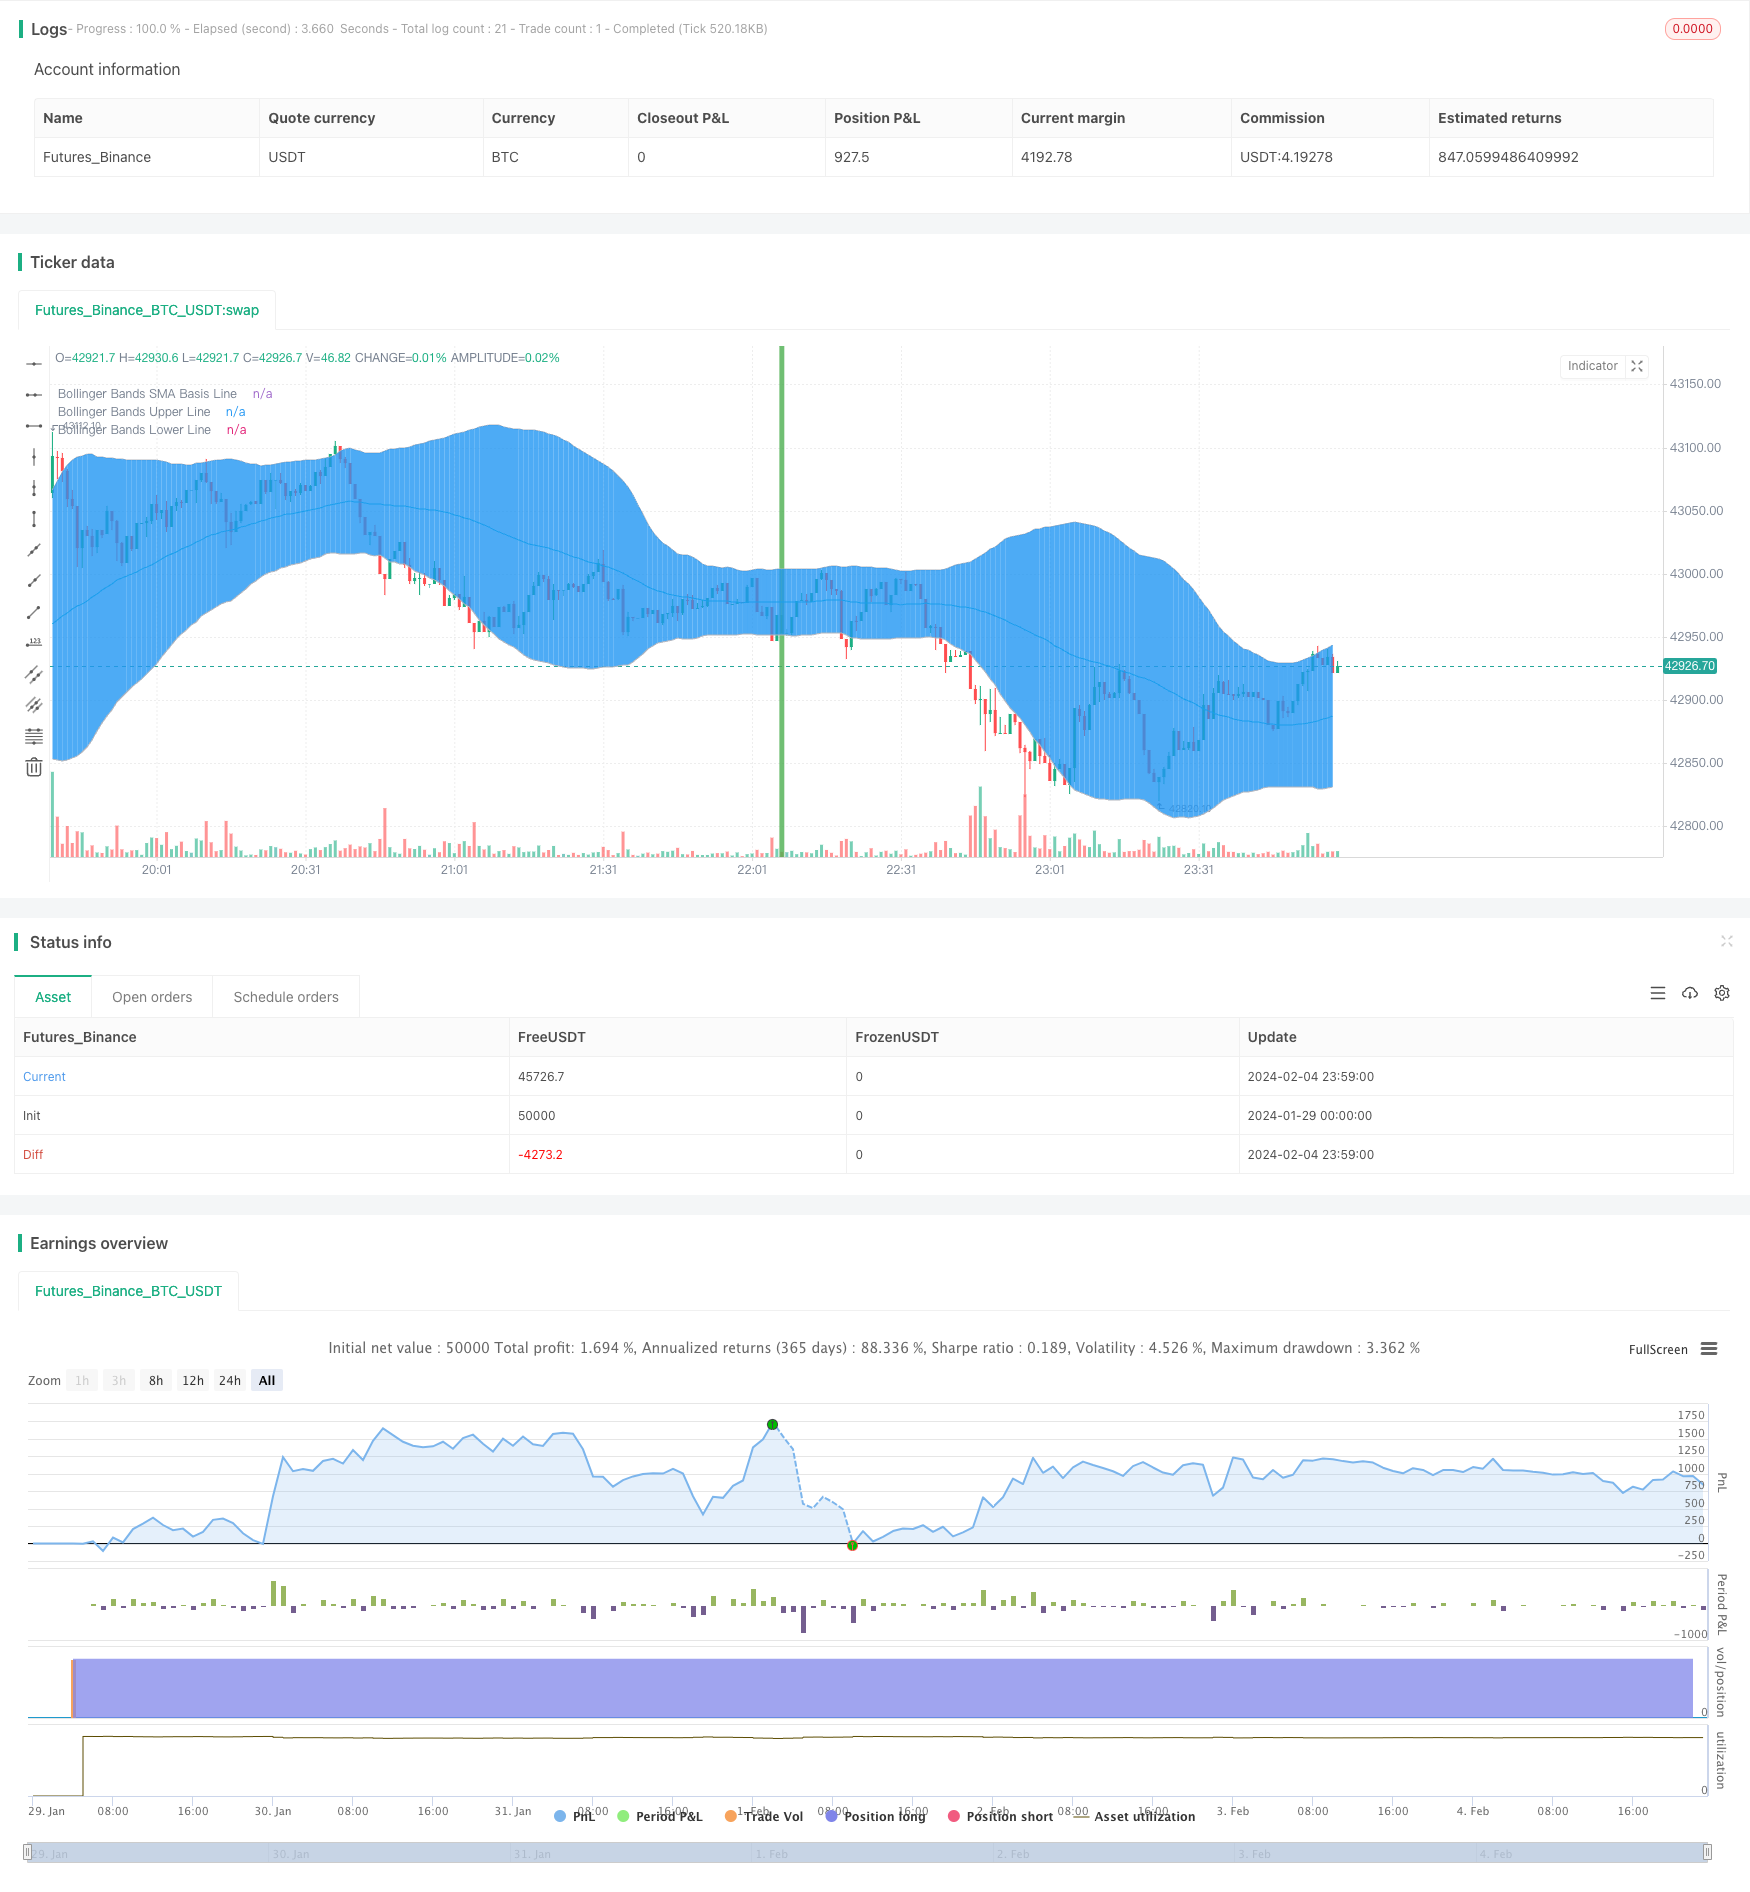
本策略通过结合相对强弱指标(RSI)和布林带这两个指标,实现了一个可以自动买入和卖出Litecoin(LTC)的交易策略。该策略适用于LTC/USD这个交易对,运行环境为Bitfinex这个数字货币交易所。
该策略主要基于以下两个指标进行交易决策:
-
相对强弱指标(Relative Strength Index,RSI):该指标可以反映一个交易品种的涨跌幅度和速度,从而判断其是否被高估或低估的程度。当RSI低于20时被视为超卖,当高于80时被视为超买。
-
布林带(Bollinger Bands):该指标包含三条线,分别是中线、上轨和下轨。中线为n天收盘价的移动平均线,上下轨分别等于中线加减2倍的n天标准差。当价格接近上轨时为超买区,接近下轨时为超卖区。
根据这两个指标,该策略的交易决策规则如下:
买入规则: 当RSI从低位上穿20时,视为超卖行情即将反转,这时如果价格突破布林带下轨则产生买入信号。
卖出规则: 当RSI从高位下穿80时,视为超买行情即将反转,这时如果价格跌破布林带上轨则产生卖出信号。
可以看出,该策略同时考量了市场的超买超卖状态和价格的突破情况,从而产生交易信号。
该策略主要具有以下几个优势:
-
结合RSI和布林带两个指标,综合判断市场状态,交易信号比较可靠。
-
RSI指标可以判断超买超卖状态,布林带指标则反映价格与常态分布的偏离程度,两者互为补充。
-
同时考量指标状态和价格突破,避免在震荡行情中产生错误信号。
-
策略参数设置合理,RSI和布林带的周期长度以及关键值都经过优化,不会轻易出现指标失效的情况。
-
该策略特定优化了LTC这个交易品种,根据历史数据回测效果较好。如果参数继续优化,效果还能进一步改善。
尽管该策略有一定的优势,但仍可能存在以下风险:
-
RSI和布林带这些指标都可能失效,特别是在异常行情中信号会不可靠。这时策略有可能产生错误交易,从而造成损失。
-
该策略主要根据历史数据进行参数优化。如果行情环境发生重大变化,这些参数设置就可能不再适用,导致策略效果下降。
-
虽然考量了两个指标,但仍有可能在震荡行情中被套牢。这种情况下会面临亏损和机会成本。
-
策略并没有考虑交易成本的问题。如果交易频率过高或仓位过大,交易成本会很快侵蚀收益。
对于以上风险,可以通过调整参数、结合更多指标、控制仓位和交易频率等方法来降低。
该策略还有以下几个优化的方向:
-
测试不同的RSI和布林带参数设置,寻找更合适的周期长度或关键值。
-
增加仓位控制措施,例如根据账户余额动态调整每次交易的头寸。
-
设置止损点,或结合其他指标判断止损和止盈的时机,降低最大回撤。
-
考虑实盘交易中的滑点成本,对参数及止损点进行修正。
-
结合更多指标,例如价格波动率指标、交易量等,形成多因子模型,提高信号的准确性。
-
针对LTC不同的行情阶段和周期,设计动态参数机制,使策略可以根据市场环境调整自己。
本策略首先判断超买超卖状态,然后结合价格突破产生交易信号,对LTC具有一定的适应性。但仍需注意防范指标失效、行情变化和交易成本等风险,有许多可优化的方向,如果进一步改进将可以获得更好的效果。
||
This strategy combines the Relative Strength Index (RSI) and Bollinger Bands to implement an automated strategy that can buy and sell Litecoin (LTC). It is suitable for the LTC/USD trading pair and runs in the Bitfinex cryptocurrency exchange.
The strategy mainly relies on the following two indicators for trading decisions:
-
Relative Strength Index (RSI): It reflects the magnitude and speed of price changes to determine if an asset is overbought or oversold. RSI below 20 is seen as oversold while above 80 is seen as overbought.
-
Bollinger Bands: It contains three lines - middle line, upper band and lower band. The middle line is the n-day moving average. The upper and lower bands are middle line ± 2 standard deviation of prices over last n days. Price near upper band suggests overbought condition and near lower band suggests oversold condition.
According to these two indicators, the trading rules are:
Buy Signal: When RSI crosses above 20 from low zone, it indicates an oversold condition that may reverse. If price also breaks below lower band of Bollinger Bands, a buy signal is triggered.
Sell Signal: When RSI crosses below 80 from high zone, it indicates an overbought condition that may reverse. If price also breaks above upper band of Bollinger Bands, a sell signal is triggered.
As we can see, the strategy considers both market overbought/oversold condition and price breakout to generate trading signals.
The main advantages of this strategy are:
-
Combines RSI and Bollinger Bands to comprehensively judge market condition, resulting in reliable signals.
-
RSI gauges overbought/oversold levels while Bollinger Bands depict price deviation from typical distribution. The two complements each other.
-
Considers both indicator readings and price breakout to avoid false signals during range-bound market.
-
Reasonable parameter settings of RSI and Bollinger Bands period and thresholds based on optimization to prevent indicator failure.
-
Specifically optimized for LTC. Performance is good based on historical data backtest. Further optimization can improve it more.
Despite the advantages, some risks exist:
-
Both RSI and Bollinger Bands may fail, especially during abnormal market condition, leading to wrong signals and losses.
-
Parameter optimization relies on historical data. Significant market regime change can make these parameters invalid, deteriorating strategy performance.
-
Although two indicators are used, whipsaws may still occur during range-bound market, causing losses and opportunity cost.
-
Trading cost is ignored in the strategy. High trading frequency and oversized position can erode profits quickly via costs.
To reduce the above risks, methods like parameter tuning, more indicators, position sizing, limiting trading frequency etc. can be adopted.
Some directions to improve the strategy:
-
Test different RSI and Bollinger Bands parameters for better settings.
-
Introduce position sizing rules based on account equity.
-
Set stop loss, or use other indicators to determine stop loss and take profit levels to limit max drawdown.
-
Consider slippage to adjust parameters and stop loss in live trading.
-
Add more factors like volatility index, volume etc to form a multifactor model for higher accuracy.
-
Design adaptive mechanisms according to different LTC market regimes and cycles to dynamically adjust strategy parameters.
This strategy judges overbought/oversold levels first and then combines with breakout to generate trading signals, making it suitable for LTC. But risks like indicator failure, regime change and trading costs should be watched out. There are many directions for improvement and further optimization can lead to better results.
[/trans]
Strategy Arguments
| Argument | Default | Description |
|---|---|---|
| v_input_1 | 2019 | Start Year |
| v_input_2 | true | Start Month |
| v_input_3 | true | Start Day |
| v_input_4 | false | Start Hour |
| v_input_5 | false | Start Minute |
| v_input_6 | 5 | RSI Period Length |
| v_input_7 | 20 | RSIL |
| v_input_8 | 80 | RSIh |
| v_input_9 | 60 | Bollinger Period Length |
| v_input_10 | 2 | Bb |
| v_input_11 | true | Enable Bar Color? |
| v_input_12 | true | Enable Background Color? |
Source (PineScript)
/*backtest
start: 2024-01-29 00:00:00
end: 2024-02-05 00:00:00
period: 1m
basePeriod: 1m
exchanges: [{"eid":"Futures_Binance","currency":"BTC_USDT"}]
*/

//@version=2
strategy("LTCUSD BB + RSI 30MIN,", shorttitle="LTCUSD BBRSI 30MIN ", overlay=true)

     // Strategy Tester Start Time
sYear = input(2019, title = "Start Year")
sMonth = input(01, title = "Start Month", minval = 01, maxval = 12)
sDay = input(01, title = "Start Day", minval = 01, maxval = 31)
sHour = input(00, title = "Start Hour", minval = 00, maxval = 23)
sMinute = input(00, title = "Start Minute", minval = 00, maxval = 59)
startTime = true


///////////// RSI
RSIlength = input(5,title="RSI Period Length")
RSIoverSold = input(20, minval=1,title="RSIL")
RSIoverBought = input(80, minval=1,title="RSIh")
price = open
vrsi = rsi(price, RSIlength)


///////////// Bollinger Bands
BBlength = input(60, minval=1,title="Bollinger Period Length")
BBmult = input(2.0, minval=0.001, maxval=50,title="Bb")
BBbasis = sma(price, BBlength)
BBdev = BBmult * stdev(price, BBlength)
BBupper = BBbasis + BBdev
BBlower = BBbasis - BBdev
source = close
buyEntry = crossover(source, BBlower)
sellEntry = crossunder(source, BBupper)
plot(BBbasis, color=aqua,title="Bollinger Bands SMA Basis Line")
p1 = plot(BBupper, color=silver,title="Bollinger Bands Upper Line")
p2 = plot(BBlower, color=silver,title="Bollinger Bands Lower Line")
fill(p1, p2)


///////////// Colors
switch1=input(true, title="Enable Bar Color?")
switch2=input(true, title="Enable Background Color?")
TrendColor = RSIoverBought and (price[1] > BBupper and price < BBupper) and BBbasis < BBbasis[1] ? red : RSIoverSold and (price[1] < BBlower and price > BBlower) and BBbasis > BBbasis[1] ? green : na
barcolor(switch1?TrendColor:na)
bgcolor(switch2?TrendColor:na,transp=50)


///////////// RSI + Bollinger Bands Strategy
if (not na(vrsi))

    if (crossover(vrsi, RSIoverSold) and crossover(source, BBlower))
        strategy.entry("RSI_BB_L", strategy.long and startTime, stop=BBlower,  comment="RSI_BB_L")
    else
        strategy.cancel(id="RSI_BB_L")

    if (crossunder(vrsi, RSIoverBought) and crossunder(source, BBupper))
        strategy.entry("RSI_BB_S", strategy.short and startTime, stop=BBupper,  comment="RSI_BB_S")
    else
        strategy.cancel(id="RSI_BB_S")

//plot(strategy.equity, title="equity", color=red, linewidth=2, style=areabr)
Detail
https://www.fmz.com/strategy/441147
Last Modified
2024-02-06 10:48:03