Name
RSI指标与平均线交叉策略Relative-Strength-Index-and-Moving-Average-Crossover-Strategy
Author
ChaoZhang
Strategy Description
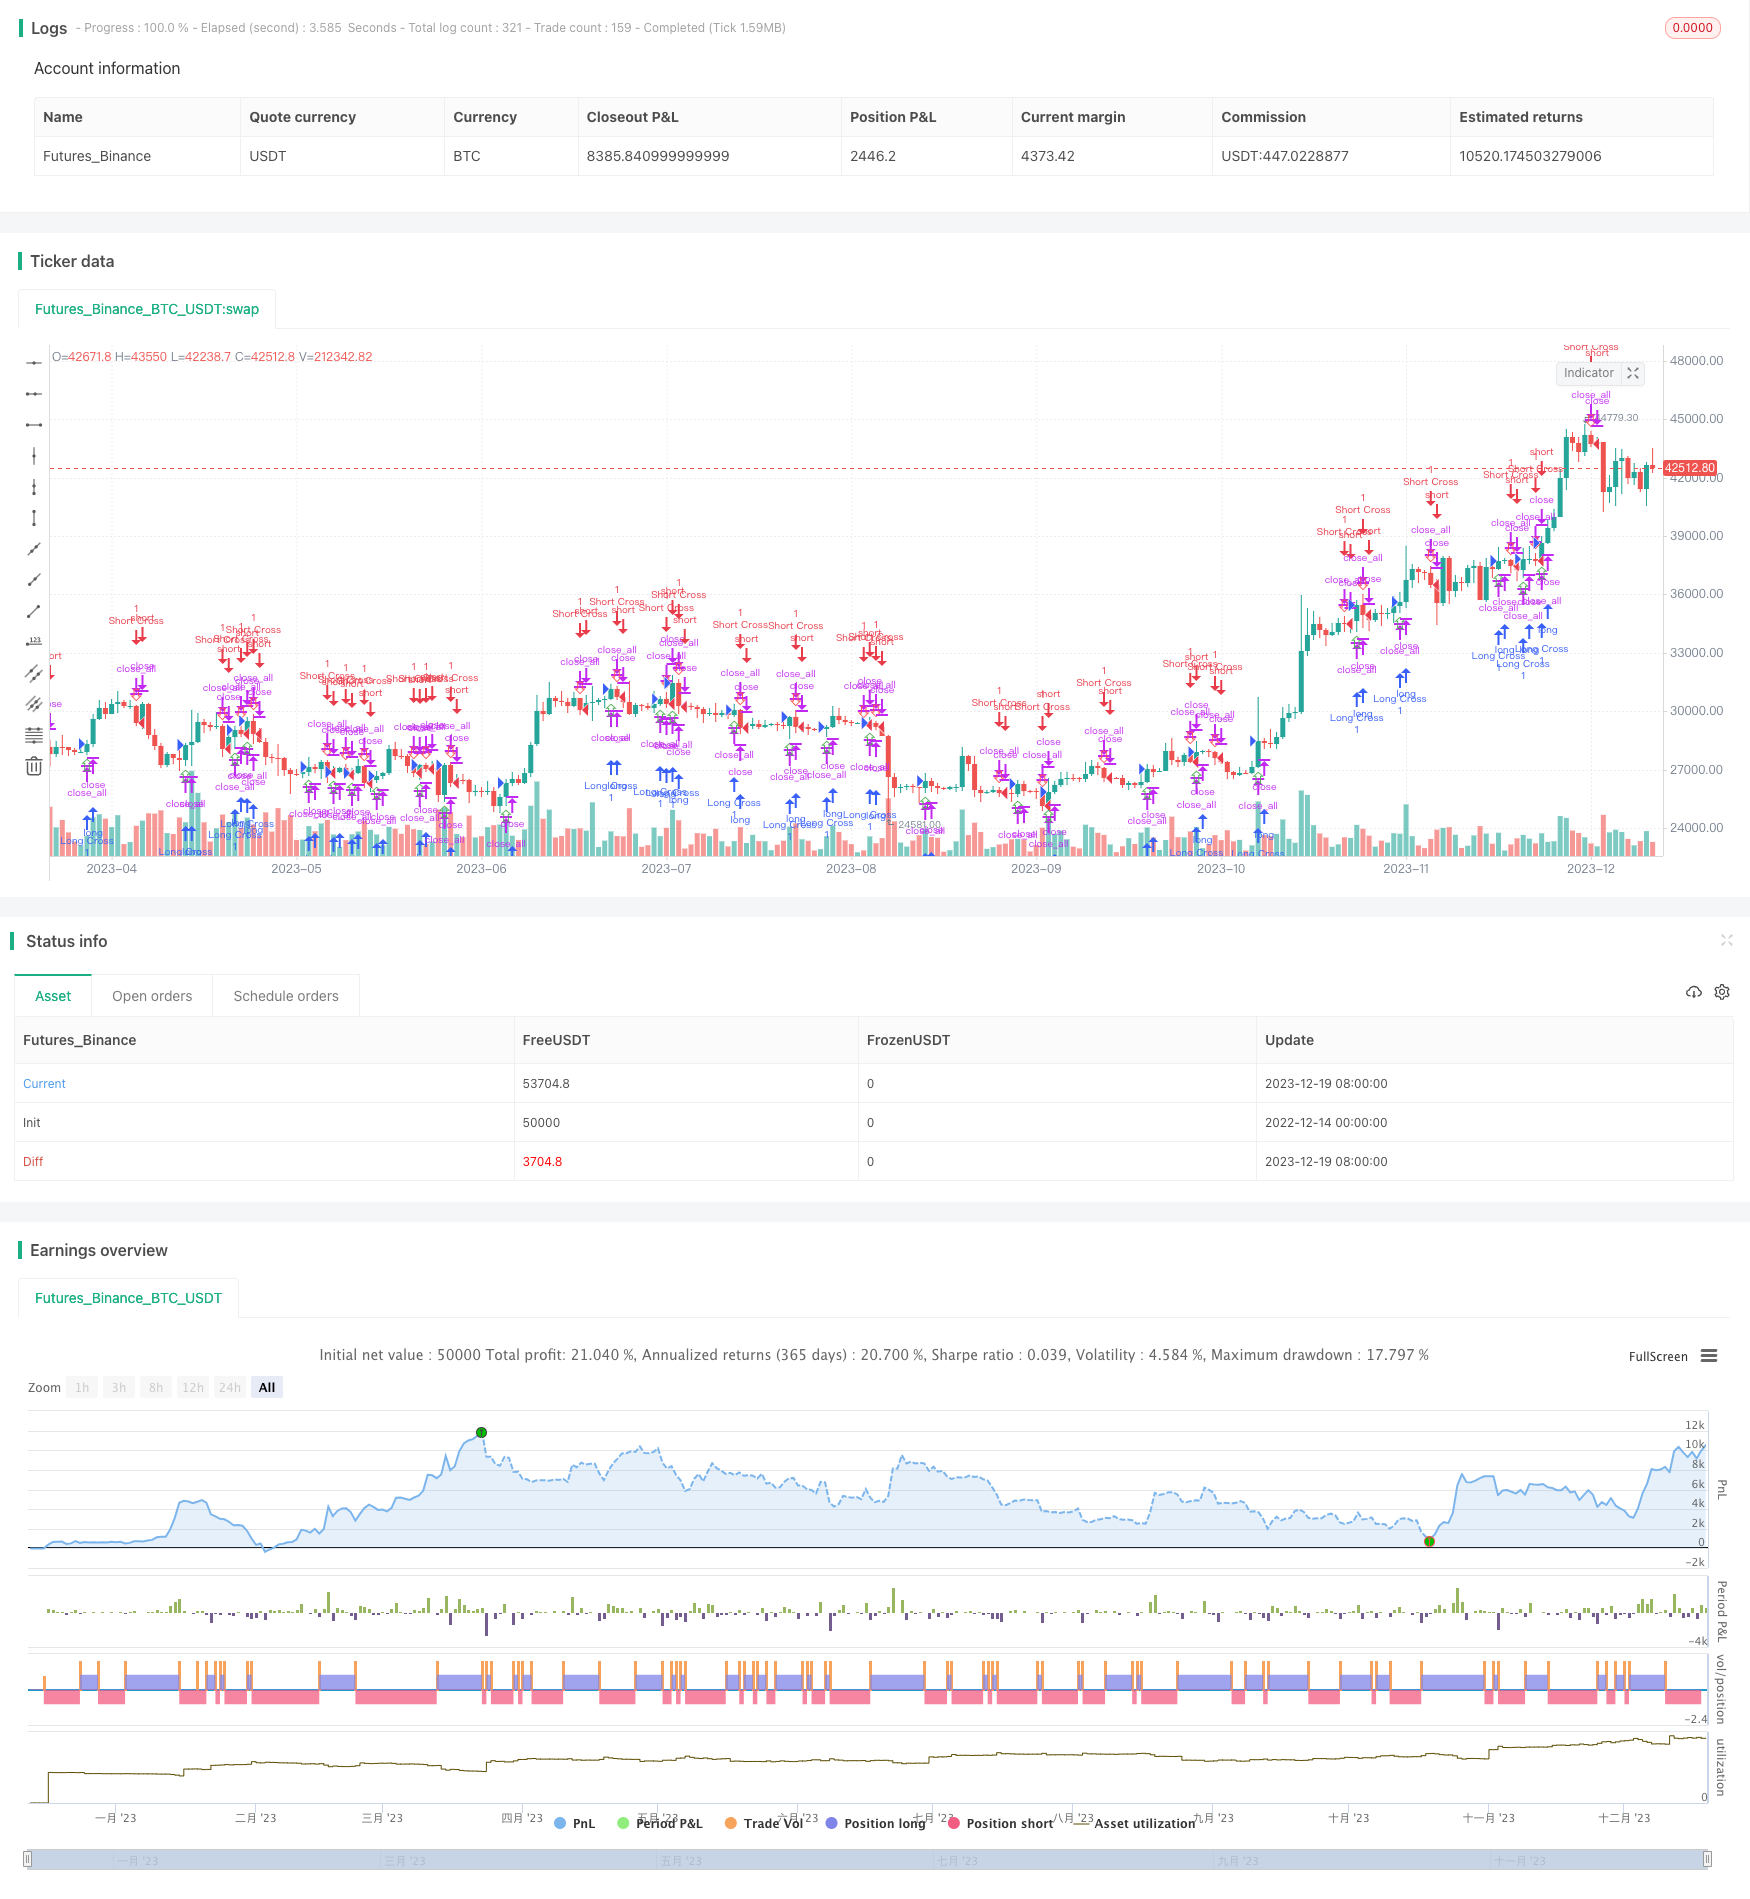
RSI指标与平均线交叉策略是一种结合相对强弱指标(RSI)和移动平均线的量化交易策略。该策略利用RSI指标判断证券价值的超买超卖情况,并结合RSI与其平均线的黄金交叉及死叉信号来决定建立看涨或看跌仓位。
-
计算RSI指标值。RSI指标基于一段时间内的涨跌幅,通过比较平均收盘涨幅和平均收盘跌幅,来判断证券是否超买或超卖。
-
计算RSI指标的移动平均线MA。采用指数移动平均线EMA或简单移动平均线SMA。
-
当RSI指标上穿其移动平均线时,产生黄金交叉信号,做多;当RSI指标下穿其移动平均线时,产生死叉信号,做空。
-
当RSI高于超买线时,认为证券超买,做空;当RSI低于超卖线时,认为证券超卖,做多。
-
结合指标与平均线交叉信号,避免做单只依靠一个指标,提高决策的准确性。
-
利用RSI指标判断超买超卖的时机,设置超买超卖线,确定建仓和止损的时机。
-
运用指标与平均线交叉做多做空,可以及时捕捉市场转折点。
-
RSI指标在震荡行情中容易产生错误信号。
-
RSI超买超卖的判断依据可以调整,设置不当可能导致过于宽松或严格。
-
均线系统对短期异常波动过于敏感,可能被套住止损。
-
调整RSI参数,寻找最佳长度参数。
-
优化移动平均线参数,寻找最佳均线周期。
-
测试不同的超买超卖线参数,优化建仓机会。
-
结合其他指标过滤信号,避免错误交易。
RSI指标与平均线交叉策略,利用RSI判断超买超卖与移动平均线交叉信号相结合,能够有效判断市场热点区域,在关键点位捕捉反转机会。通过参数优化和信号过滤,可以改进策略表现,减少交易风险。该策略适合中短线交易者,可以提供较好的超额收益。
||
The Relative Strength Index (RSI) and Moving Average Crossover strategy combines the RSI indicator and moving averages to make quantitative trading decisions. It utilizes the overbought and oversold levels indicated by RSI to determine entries and exits, alongside golden cross and death cross signals generated when RSI crosses its moving average line.
-
Calculate the RSI indicator value. RSI measures the magnitude of recent price changes to evaluate if an asset is overbought or oversold.
-
Compute a moving average line (MA) of RSI, using an Exponential Moving Average (EMA) or Simple Moving Average (SMA).
-
When RSI crosses above its MA line, a golden cross buy signal is generated. When RSI crosses below its MA line, a death cross sell signal is triggered.
-
When RSI rises above the overbought threshold, the asset is considered overbought and a short position can be initiated. When RSI falls below the oversold threshold, the asset is considered oversold and a long position can be opened.
-
Combining indicator crossover signals with RSI overbought/oversold levels improves the accuracy of trading decisions.
-
RSI overbought and oversold thresholds determine optimal entries and exits.
-
Capturing trend reversals by acting on indicator crossover signals.
-
RSI may generate incorrect signals during choppy or sideways markets.
-
Improper overbought or oversold threshold settings could lead to signals that are too loose or too strict.
-
Moving averages are sensitive to short-term anomalies and volatility spikes, increasing the likelihood of being stopped out prematurely.
-
Optimize RSI parameter by testing different length periods.
-
Find the optimal moving average periods by assessing different MA lengths.
-
Test various overbought and oversold threshold levels to refine entry signals.
-
Incorporate additional filters to validate signals and avoid false trades.
The RSI and Moving Average Crossover Strategy combines RSI overbought/oversold levels with MA crossover signals to identify market turning points and capture reversals. Performance and risk management can be enhanced through parameter optimization and signal filtering. This medium-term trading strategy offers strong alpha generation potential for experienced investors.
[/trans]
Strategy Arguments
| Argument | Default | Description |
|---|---|---|
| v_input_1 | 13 | Length |
| v_input_2 | 9 | MA Lenght |
| v_input_3 | false | Exponential |
| v_input_4 | 10 | From Month |
| v_input_5 | 3 | From Day |
| v_input_6 | 2017 | From Year |
| v_input_7 | true | To Month |
| v_input_8 | true | To Day |
| v_input_9 | 9999 | To Year |
| v_input_10 | 90 | RSI % start overbought |
| v_input_11 | 10 | RSI % start oversold |
Source (PineScript)
/*backtest
start: 2022-12-14 00:00:00
end: 2023-12-20 00:00:00
period: 1d
basePeriod: 1h
exchanges: [{"eid":"Futures_Binance","currency":"BTC_USDT"}]
*/

//@version=3
//dfurrer45
strategy(title="Relative Strength Index", shorttitle="RSI", overlay=true)
src = close, len = input(13, minval=1, title="Length"), maLen = input(9, minval=1, title="MA Lenght"), exponential = input(false, title="Exponential")

// === BACKTEST RANGE ===
FromMonth = input(defval = 10, title = "From Month", minval = 1)
FromDay   = input(defval = 3, title = "From Day", minval = 1)
FromYear  = input(defval = 2017, title = "From Year", minval = 2014)
ToMonth   = input(defval = 1, title = "To Month", minval = 1)
ToDay     = input(defval = 1, title = "To Day", minval = 1)
ToYear    = input(defval = 9999, title = "To Year", minval = 2014)
// ===  BACKTEST END  ===
backtestdaterange = (time > timestamp(FromYear, FromMonth, FromDay, 00, 00))

rsioverbought = input(90, minval=1, title="RSI % start overbought")
rsioversold = input(10, minval=1, title="RSI % start oversold")
up = rma(max(change(src), 0), len)
down = rma(-min(change(src), 0), len)
rsi = down == 0 ? 100 : up == 0 ? 0 : 100 - (100 / (1 + up / down))
ma = exponential ? ema(rsi, maLen) : sma(rsi, maLen)
rsimacrossup = cross(rsi,ma) and rsi > ma
rsimacrossdown = cross(rsi,ma) and rsi < ma
plotchar(rsimacrossup, char='⇧', location = location.belowbar, color = green, text = "", textcolor = green, size=size.small)
plotchar(rsimacrossdown, char='⇩', location = location.abovebar, color = red, text = "", textcolor = red, size=size.small)
plotchar(rsi > rsioverbought, char='x', location = location.belowbar, color = aqua, text = "", textcolor = red, size=size.small)
plotchar(rsi < rsioversold, char='x', location = location.belowbar, color = aqua, text = "", textcolor = red, size=size.small)


closetrade = rsimacrossup or rsimacrossdown
strategy.close_all(closetrade)
strategy.close_all((rsi > rsioverbought) or (rsi < rsioversold))
strategy.entry("Short Overbought",strategy.short, when=(rsi > rsioverbought) and backtestdaterange)
strategy.entry("Buy Overbought",strategy.long, when=(rsi < rsioversold) and backtestdaterange)
strategy.entry("Long Cross", strategy.long, when=rsimacrossup and backtestdaterange)
strategy.entry("Short Cross", strategy.short, when=rsimacrossdown and backtestdaterange)
Detail
https://www.fmz.com/strategy/436099
Last Modified
2023-12-21 11:30:27