Name
RSI指标分歧交易策略RSI-Divergence-Trading-Strategy
Author
ChaoZhang
Strategy Description
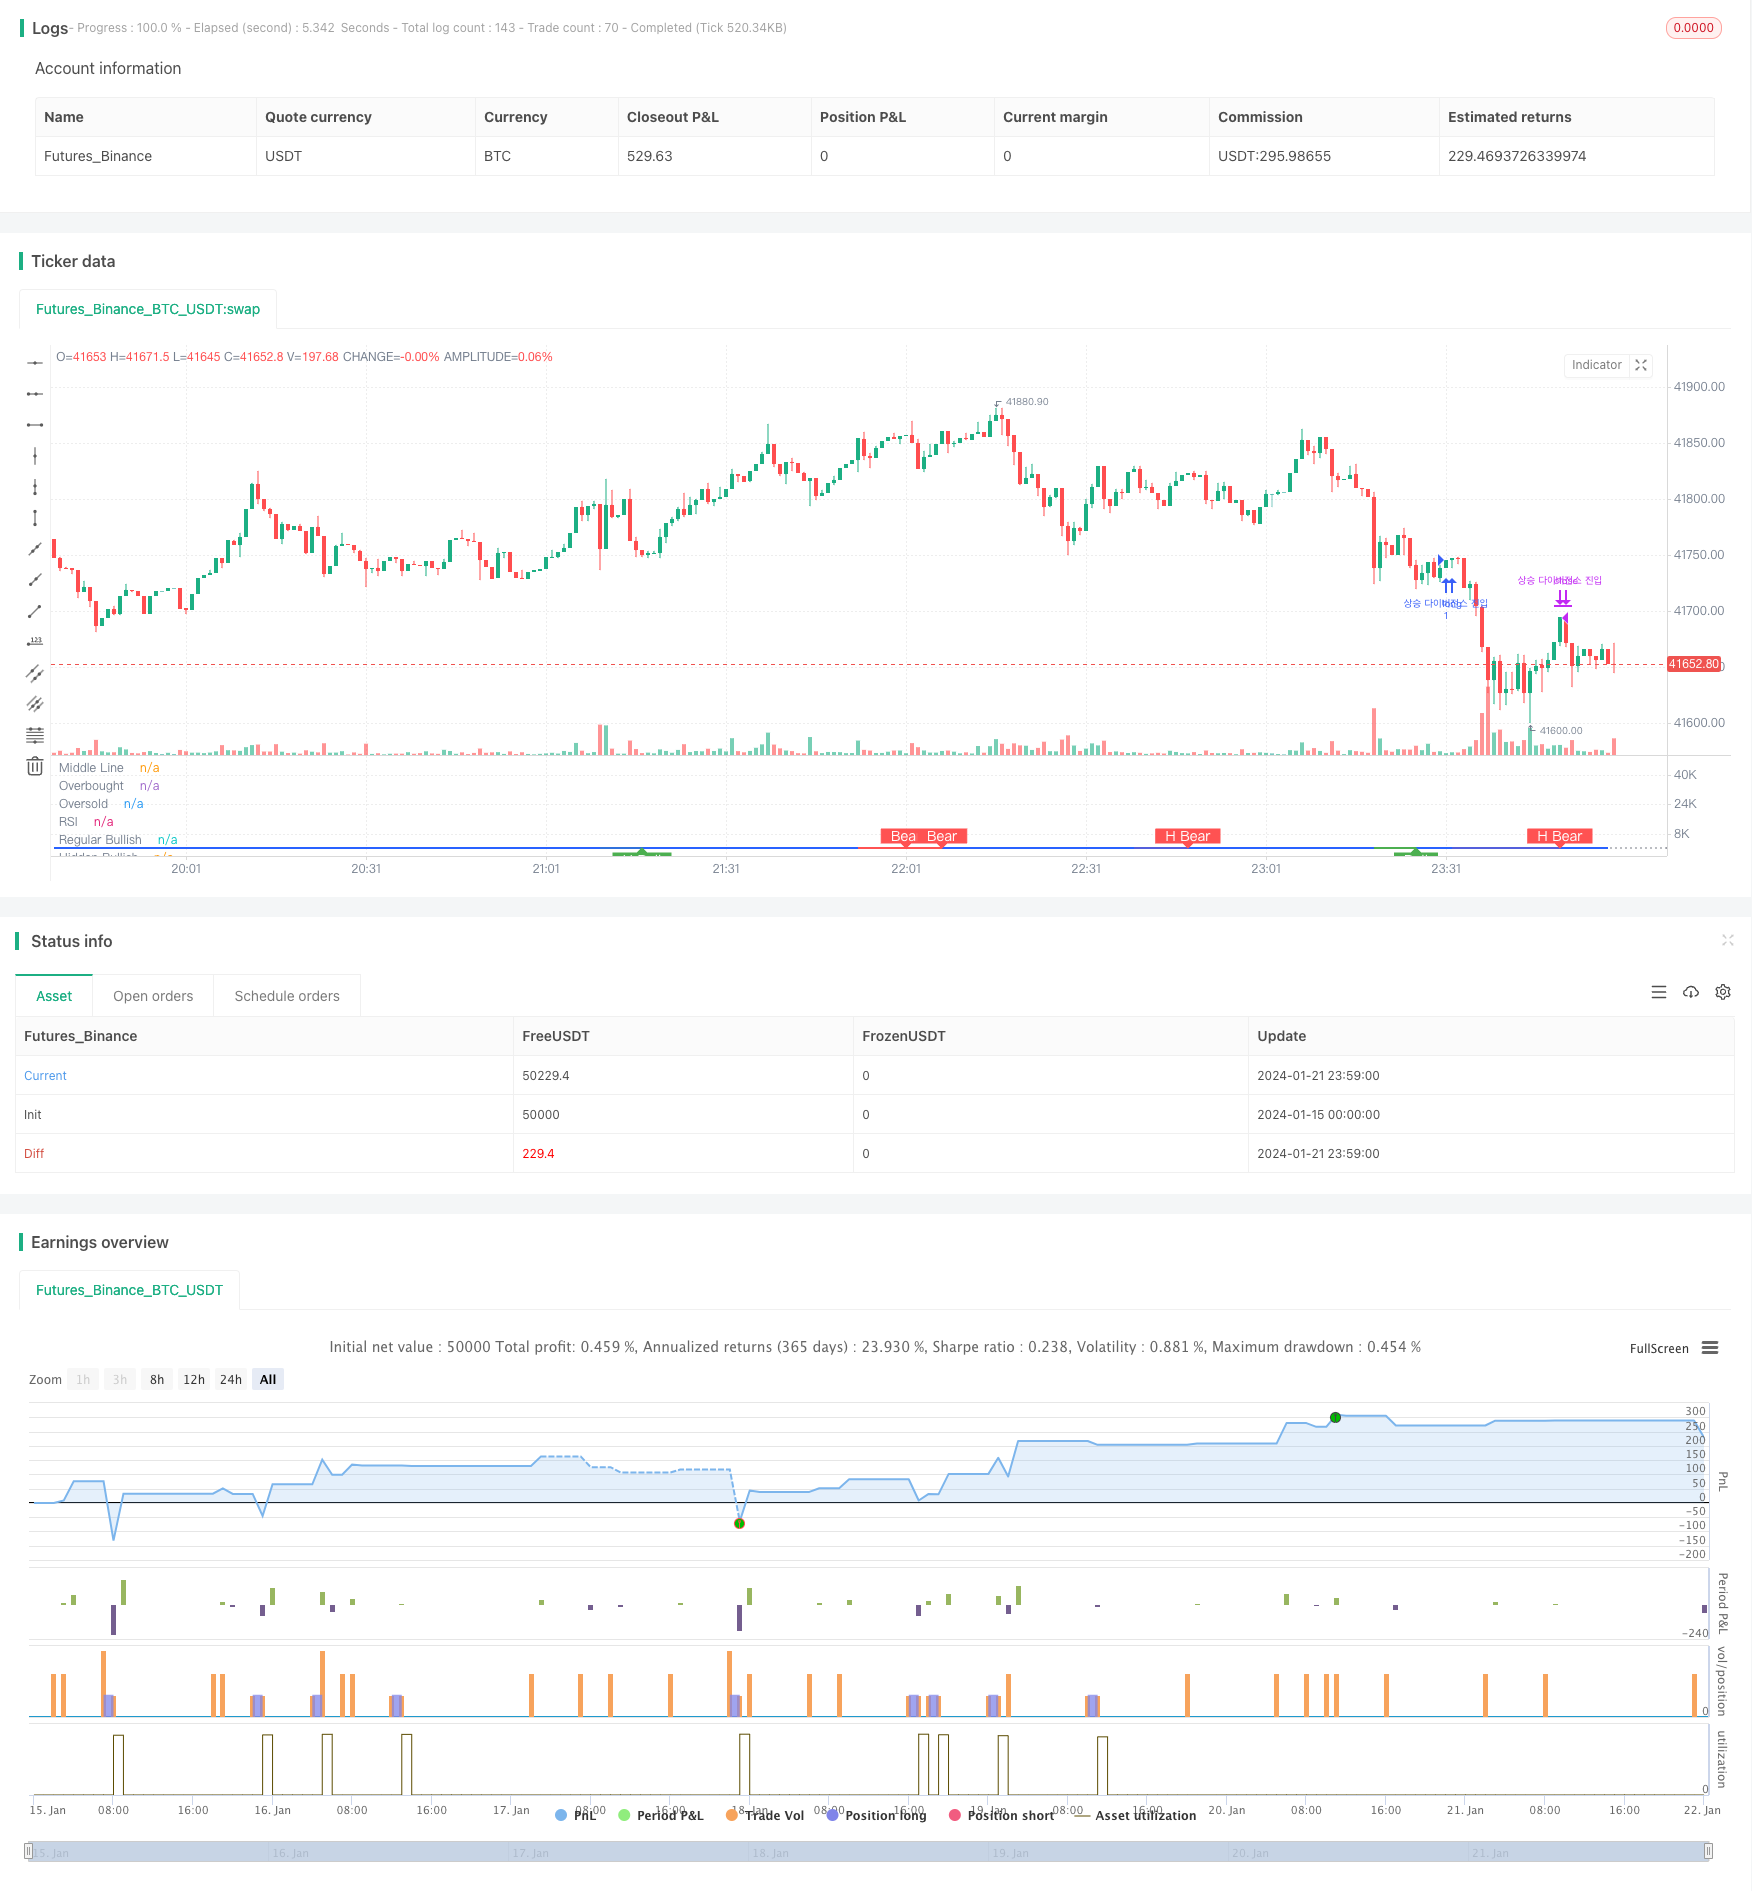
RSI指标分歧交易策略通过分析RSI指标与价格的背离,发现价值分歧的机会,在背离出现时做多做空。
该策略基于RSI指标与价格出现背离时的价值分歧。RSI指标反映强弱势,价格反映供需关系。当二者出现分歧时,说明市场存在误价,可以做空买入或做多卖出获利。
具体来说,常规的多头分歧是RSI形成更高低点,而价格形成更低低点。这表示市场虽然表面看跌,但实际已经具有蓄力反弹的迹象。当RSI背离价格,向上突破50分界线时,可以捕捉这个反弹机会。
常规的空头分歧则相反,RSI形成更低高点,价格却形成更高高点。这表示市场表面看涨,但实际内在已经显示疲软迹象。当RSI背离价格,向下突破50分界线时,可以做空获利。
此外,还有隐藏的多头分歧和空头分歧情况。这时RSI和价格的关系与常规分歧相反,但原理相同,也可获利。
- 捕捉价值分歧,发现市场误差定价
- 结合指标与价格背离,提高胜率
- 区分多种分歧情况,覆盖更多机会
- 特殊市场情况下也会出现假象分歧,需要识别
- 突破50分界线的胜率并不高,可适当优化
- 多空方向选择错误可能导致较大亏损
- 优化RSI参数,提高指标预测准确性
- 结合其他指标信号判断背离分歧
- 评估做多做空获利风险比,控制单笔盈亏
RSI指标分歧策略通过分析价值与价格的背离,发现市场误差定价,是一种典型的统计套利策略。该策略优势在于及时发现趋势反转机会,风险在于 分歧识别的准确性。通过不断优化,能够在实战中取得稳定收益。
||
The RSI divergence trading strategy captures mispricing opportunities by analyzing the divergence between the RSI indicator and price. It goes long or short when the divergence appears.
The strategy is based on the value-price divergence when RSI diverges from price. RSI reflects the strength while price reflects the supply-demand relationship. When the two diverge, it indicates market mispricing for arbitrage.
Specifically, a regular bullish divergence happens when RSI forms a higher low while price prints a lower low. This shows that although the market looks weak on the surface, it is actually garnering strength internally for a bounce. When RSI diverges from price and breaks above the 50-line, it presents an opportunity to catch the bounce.
A regular bearish divergence happens when RSI makes a lower high while price forms a higher high. This suggests that although the market looks strong externally, it is showing weakness signals internally. When RSI diverges from price and breaks below the 50-line, it allows profiting from the short side.
There are also hidden bullish and bearish divergences where the relationship between RSI and price is opposite of regular divergences, but the logic remains the same for taking profits.
- Captures market mispricing from value-price divergence
- Improves win rate combining indicator and price divergence
- Covers more opportunities distinguishing all types of divergences
- Fake divergences can happen under special market conditions
- Breaking 50-line has relatively low success rate, can optimize
- Picking wrong direction could lead to big losses
- Optimize RSI parameters for higher accuracy
- Combine signals from other indicators to confirm divergences
- Assess risk-reward for longs and shorts to control per trade loss
The RSI divergence strategy arbitrages market mispricing through analyzing divergence between value and price signals. Its advantage lies in timely catching trend reversal opportunities, while its risk comes from the accuracy of divergence recognition. With continuous optimization, steady gains can be achieved in live trading. [/trans]
Strategy Arguments
| Argument | Default | Description |
|---|---|---|
| v_input_int_1 | 14 | RSI Period |
| v_input_1_close | 0 | RSI Source: close |
| v_input_2 | 5 | Pivot Lookback Right |
| v_input_3 | 5 | Pivot Lookback Left |
| v_input_4 | 60 | Max of Lookback Range |
| v_input_5 | 5 | Min of Lookback Range |
| v_input_6 | true | Plot Bullish |
| v_input_7 | true | Plot Hidden Bullish |
| v_input_8 | true | Plot Bearish |
| v_input_9 | true | Plot Hidden Bearish |
Source (PineScript)
/*backtest
start: 2024-01-15 00:00:00
end: 2024-01-22 00:00:00
period: 1m
basePeriod: 1m
exchanges: [{"eid":"Futures_Binance","currency":"BTC_USDT"}]
*/

//@version=5
strategy(title="Divergence Indicator")
len = input.int(title="RSI Period", minval=1, defval=14)
src = input(title="RSI Source", defval=close)
lbR = input(title="Pivot Lookback Right", defval=5)
lbL = input(title="Pivot Lookback Left", defval=5)
rangeUpper = input(title="Max of Lookback Range", defval=60)
rangeLower = input(title="Min of Lookback Range", defval=5)
plotBull = input(title="Plot Bullish", defval=true)
plotHiddenBull = input(title="Plot Hidden Bullish", defval=true)
plotBear = input(title="Plot Bearish", defval=true)
plotHiddenBear = input(title="Plot Hidden Bearish", defval=true)
bearColor = color.red
bullColor = color.green
hiddenBullColor = color.new(color.green, 80)
hiddenBearColor = color.new(color.red, 80)
textColor = color.white
noneColor = color.new(color.white, 100)
osc = ta.rsi(src, len)

plot(osc, title="RSI", linewidth=2, color=#2962FF)
hline(50, title="Middle Line", color=#787B86, linestyle=hline.style_dotted)
obLevel = hline(70, title="Overbought", color=#787B86, linestyle=hline.style_dotted)
osLevel = hline(30, title="Oversold", color=#787B86, linestyle=hline.style_dotted)
fill(obLevel, osLevel, title="Background", color=color.rgb(33, 150, 243, 90))

plFound = na(ta.pivotlow(osc, lbL, lbR)) ? false : true
phFound = na(ta.pivothigh(osc, lbL, lbR)) ? false : true
_inRange(cond) =>
	bars = ta.barssince(cond == true)
	rangeLower <= bars and bars <= rangeUpper

//------------------------------------------------------------------------------
// Regular Bullish
// Osc: Higher Low

oscHL = osc[lbR] > ta.valuewhen(plFound, osc[lbR], 1) and _inRange(plFound[1])

// Price: Lower Low

priceLL = low[lbR] < ta.valuewhen(plFound, low[lbR], 1)
// bull : 상승 Condition : 조건
bullCond = plotBull and priceLL and oscHL and plFound // 상승다이버전스?
strategy.entry("상승 다이버전스 진입", strategy.long, when = bullCond)
strategy.close("상승 다이버전스 진입", when = ta.crossover(osc, 50))
plot(
     plFound ? osc[lbR] : na,
     offset=-lbR,
     title="Regular Bullish",
     linewidth=2,
     color=(bullCond ? bullColor : noneColor)
     )

plotshape(
	 bullCond ? osc[lbR] : na,
	 offset=-lbR,
	 title="Regular Bullish Label",
	 text=" Bull ",
	 style=shape.labelup,
	 location=location.absolute,
	 color=bullColor,
	 textcolor=textColor
	 )

//------------------------------------------------------------------------------
// Hidden Bullish
// Osc: Lower Low

oscLL = osc[lbR] < ta.valuewhen(plFound, osc[lbR], 1) and _inRange(plFound[1])

// Price: Higher Low

priceHL = low[lbR] > ta.valuewhen(plFound, low[lbR], 1)
hiddenBullCond = plotHiddenBull and priceHL and oscLL and plFound
// strategy.entry("히든 상승 다이버전스 진입", strategy.long, when = hiddenBullCond)
// strategy.close("히든 상승 다이버전스 진입", when = ta.crossover(osc, 50))
plot(
	 plFound ? osc[lbR] : na,
	 offset=-lbR,
	 title="Hidden Bullish",
	 linewidth=2,
	 color=(hiddenBullCond ? hiddenBullColor : noneColor)
	 )

plotshape(
	 hiddenBullCond ? osc[lbR] : na,
	 offset=-lbR,
	 title="Hidden Bullish Label",
	 text=" H Bull ",
	 style=shape.labelup,
	 location=location.absolute,
	 color=bullColor,
	 textcolor=textColor
	 )

//------------------------------------------------------------------------------
// Regular Bearish
// Osc: Lower High

oscLH = osc[lbR] < ta.valuewhen(phFound, osc[lbR], 1) and _inRange(phFound[1])

// Price: Higher High

priceHH = high[lbR] > ta.valuewhen(phFound, high[lbR], 1)
// bear : 하락
bearCond = plotBear and priceHH and oscLH and phFound
// strategy.entry("하락 다이버전스 진입", strategy.short, when = bearCond)
// strategy.close("하락 다이버전스 진입", when = ta.crossunder(osc, 50))
plot(
	 phFound ? osc[lbR] : na,
	 offset=-lbR,
	 title="Regular Bearish",
	 linewidth=2,
	 color=(bearCond ? bearColor : noneColor)
	 )

plotshape(
	 bearCond ? osc[lbR] : na,
	 offset=-lbR,
	 title="Regular Bearish Label",
	 text=" Bear ",
	 style=shape.labeldown,
	 location=location.absolute,
	 color=bearColor,
	 textcolor=textColor
	 )

//------------------------------------------------------------------------------
// Hidden Bearish
// Osc: Higher High

oscHH = osc[lbR] > ta.valuewhen(phFound, osc[lbR], 1) and _inRange(phFound[1])

// Price: Lower High

priceLH = high[lbR] < ta.valuewhen(phFound, high[lbR], 1)

hiddenBearCond = plotHiddenBear and priceLH and oscHH and phFound
// strategy.entry("히든 하락 다이버전스 진입", strategy.short, when = hiddenBearCond)
// strategy.close("히든 하락 다이버전스 진입", when = ta.crossunder(osc, 50))
plot(
	 phFound ? osc[lbR] : na,
	 offset=-lbR,
	 title="Hidden Bearish",
	 linewidth=2,
	 color=(hiddenBearCond ? hiddenBearColor : noneColor)
	 )

plotshape(
	 hiddenBearCond ? osc[lbR] : na,
	 offset=-lbR,
	 title="Hidden Bearish Label",
	 text=" H Bear ",
	 style=shape.labeldown,
	 location=location.absolute,
	 color=bearColor,
	 textcolor=textColor
	 )
Detail
https://www.fmz.com/strategy/439702
Last Modified
2024-01-23 11:08:48