Name
Stochastic-Supertrend跟踪止损交易策略Stochastic-Supertrend-Tracking-Stop-Loss-Trading-Strategy
Author
ChaoZhang
Strategy Description
[trans]
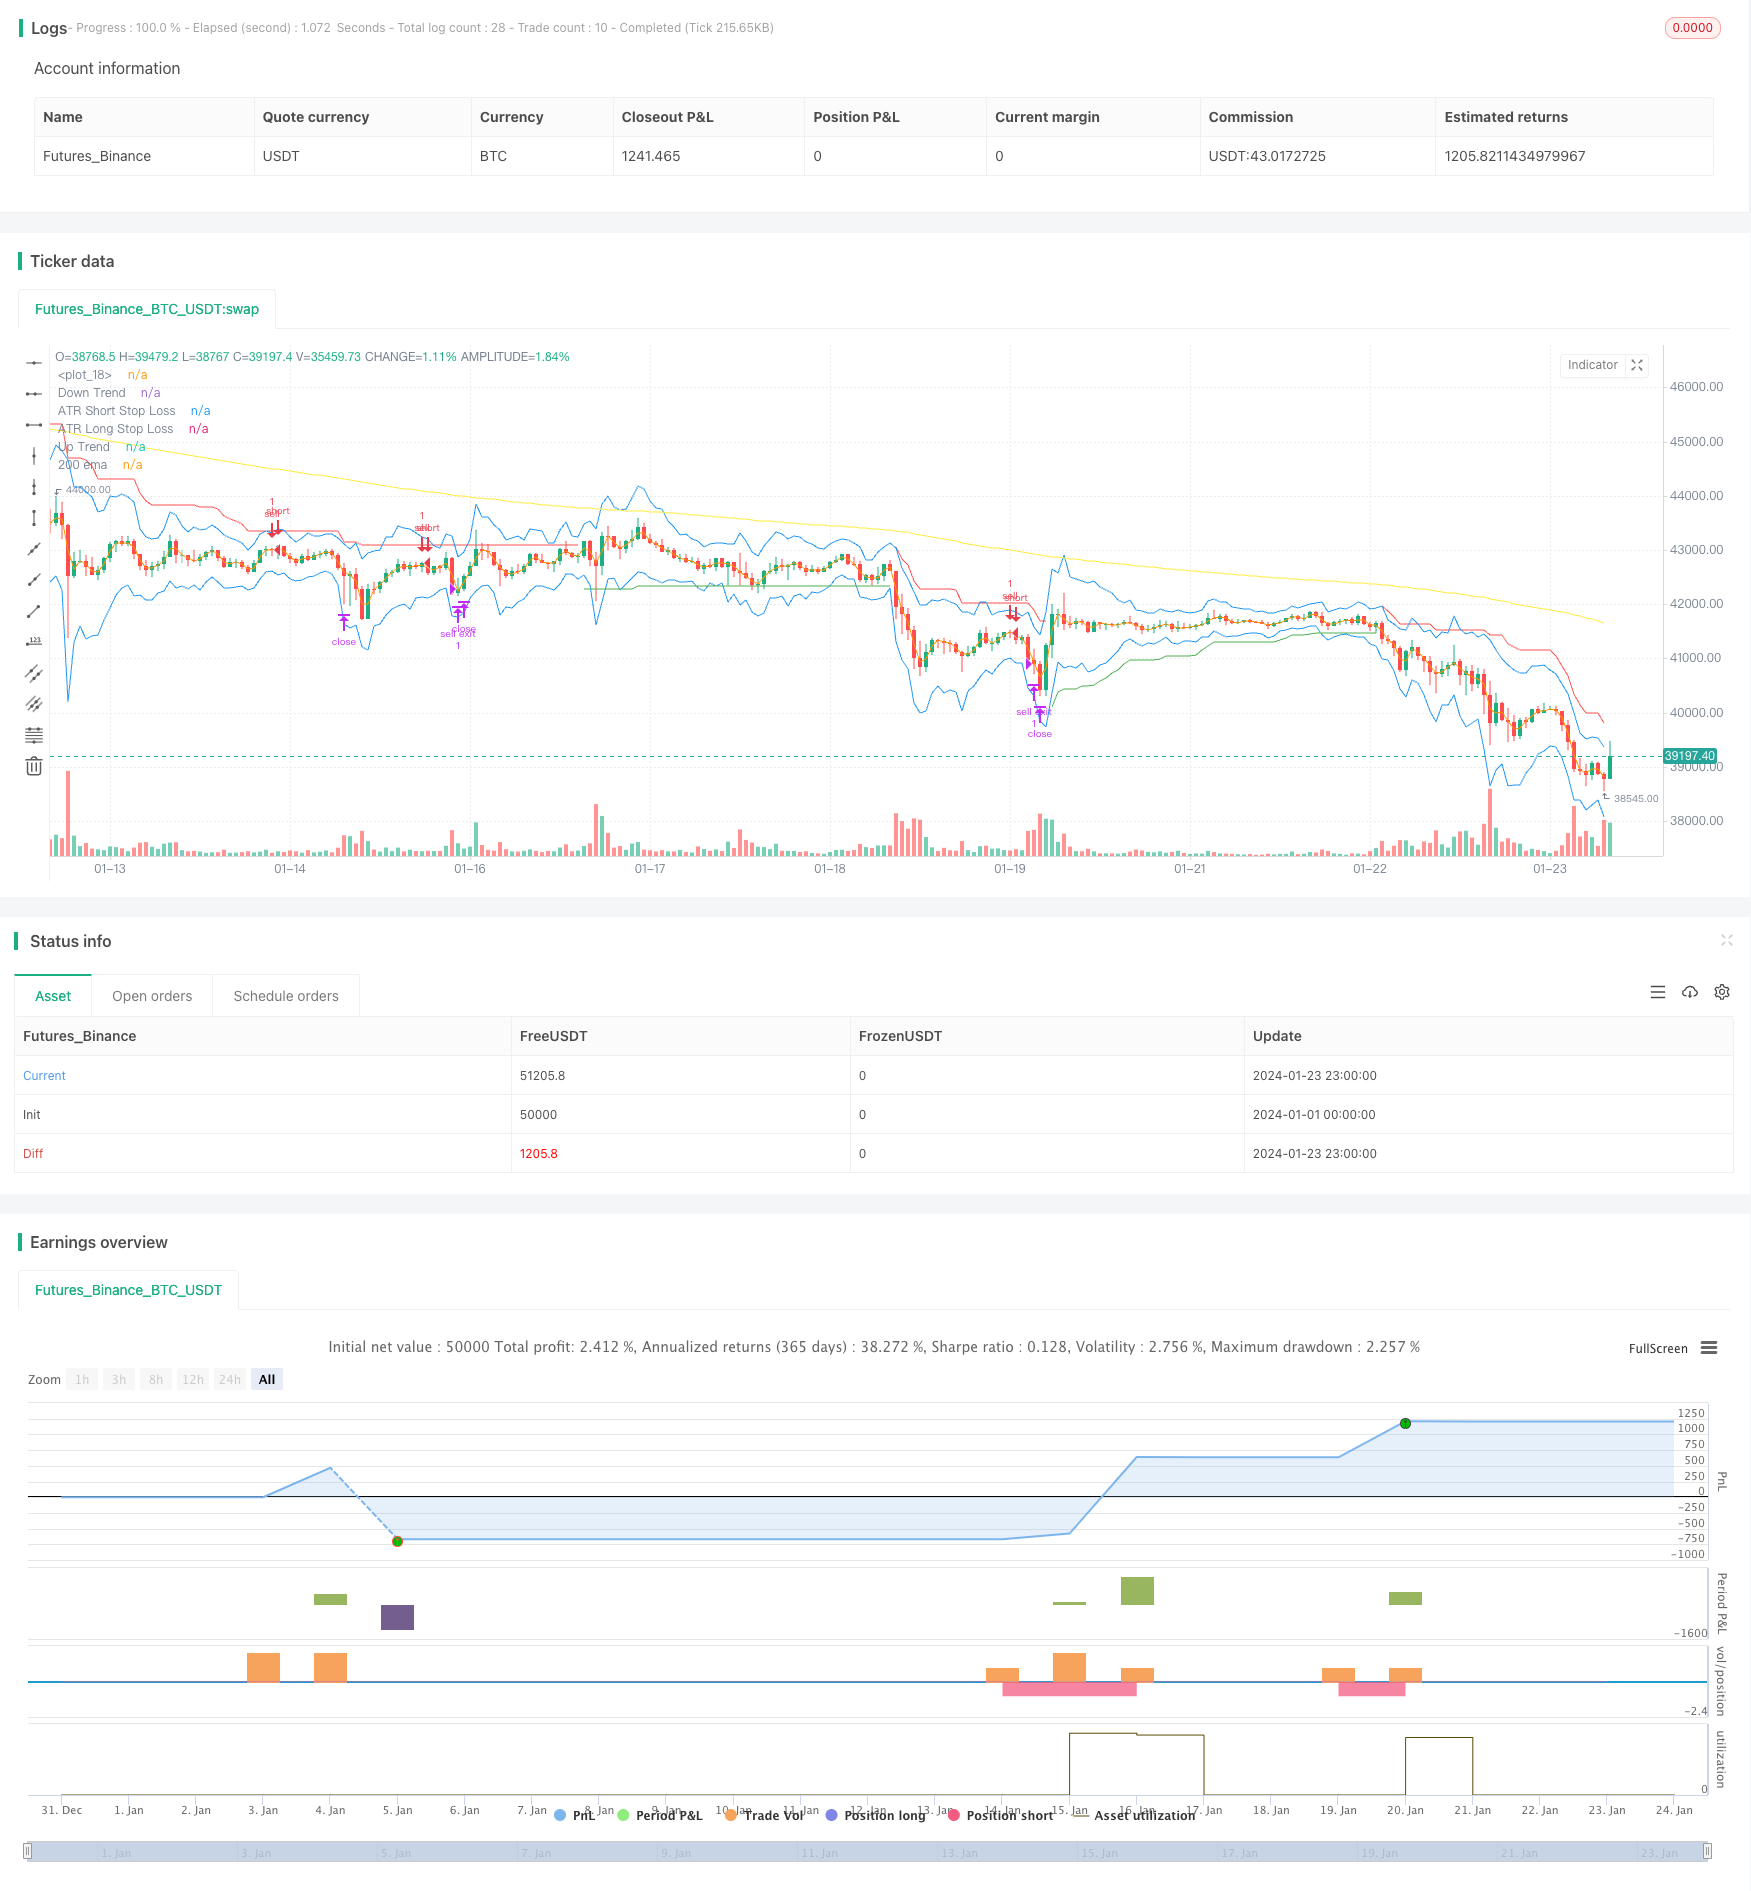
这是一个结合多种技术指标的跟踪止损交易策略。主要使用 Supertrend、Stochastic、200日移动平均线和ATR止损这些指标来识别交易信号和设置止损位。该策略适合中长线趋势交易,可以有效控制风险。
当Stochastic K线从超买区下落、Supertrend指示趋势向上、价格突破200日移动平均线时,做多;当Stochastic K线从超卖区上涨、Supertrend指示趋势向下、价格跌破200日移动平均线时,做空。交易后使用ATR指标动态设置止损位。
具体来说,当Stochastic K值上穿80时,视为超买信号;当Stochastic K值下穿20时,视为超卖信号。Supertrend指标决定价格趋势方向,Supertrend指示向上时代表价格处于上涨趋势,Supertrend指示向下时代表价格处于下跌趋势。ATR指标用来计算真实波幅。
做多信号触发条件:Stochastic K线从超买区下落(小于80)、Supertrend指示向上、价格高于200日移动平均线。
做空信号触发条件:Stochastic K线从超卖区上涨(大于20)、Supertrend指示向下、价格低于200日移动平均线。
入场后,设置ATR止损来跟踪价格波动控制风险。多单止损为最低价减去ATR值乘以系数;空单止损为最高价加上ATR值乘以系数。
这种策略结合多种指标判断趋势方向和入场时机,可以有效过滤假信号。同时,采用ATR动态跟踪止损,可以根据市场波动情况来控制风险,最大程度保存资金。
相比简单移动平均线等趋势跟踪策略,这种策略可以更好地捕捉转折点。相比单一止损方式,这种ATR动态止损可以更加灵活。所以,这种策略整体来说具有较好的风险收益比。
该策略主要依赖指标判断,如果指标发出错误信号,则可能导致由于反向操作亏损。另外在震荡行情中,止损可能被频繁触发,带来损失。
此外,ATR止损虽然可以根据波动调整止损位,但无法完全避免止损被击穿的概率。如果遇到价格跳空,止损单可能会被直接触发。
这种策略可以从以下几个维度进行优化:
-
调整指标参数,优化买卖信号的准确率。例如可以测试不同参数的Stochastic指标,或者调整Supertrend指标的ATR周期和乘数参数。
-
测试其他止损方式的效果。例如可以尝试比ATR止损更加灵活的自适应智能止损算法,或者考虑让止损跟随一个移动止损位。
-
增加过滤条件,在更加可靠的情况下入场。例如可以增加交易量能量指标等过滤器,避免在量能不足时依据指标错误入场。
-
优化资金管理策略,例如动态调整仓位。
Stochastic Supertrend跟踪止损交易策略综合运用了多种指标判断趋势方向,并采用ATR智能跟踪来控制风险。这种策略可以有效过滤噪音别入场,具有较好的风险收益比。我们可以通过调整参数、修改止损方式以及增加过滤条件等方法来不断优化这一策略,使其能够适应更加复杂的市场环境。
||
This is a tracking stop loss trading strategy that combines multiple technical indicators. It mainly uses indicators like Supertrend, Stochastic, 200-day Moving Average and ATR stop loss to identify trading signals and set stop loss levels. This strategy is suitable for medium-to-long term trend trading and can effectively control risks.
Go long when the Stochastic K line falls from the overbought zone, the Supertrend indicates an upward trend, and the price breaks through the 200-day moving average; Go short when the Stochastic K line rises from the oversold zone, the Supertrend indicates a downward trend, and the price falls below the 200-day moving average. Use the ATR indicator to dynamically set the stop loss after entering the position.
Specifically, when the Stochastic K value crosses above 80, it is considered an overbought signal; when the Stochastic K value crosses below 20, it is considered an oversold signal. The Supertrend indicator determines the price trend direction. When Supertrend points up, it means the price is in an upward trend. When Supertrend points down, it means the price is in a downward trend. The ATR indicator is used to calculate the true volatility.
Long signal entry conditions: Stochastic K line falls from overbought territory (below 80), Supertrend points up, price above 200-day MA.
Short signal entry conditions: Stochastic K line rises from oversold territory (above 20), Supertrend points down, price below 200-day MA.
After entering the position, set the ATR stop loss to track price fluctuations to control risks. The long stop loss is the lowest price minus the ATR value multiplied by a coefficient; the short stop loss is the highest price plus the ATR value multiplied by a coefficient.
This strategy combines multiple indicators to determine the trend direction and entry timing, which can effectively filter false signals. At the same time, by adopting dynamic ATR tracking stop loss, it can control risks according to market fluctuations to maximize capital preservation.
Compared with simple moving average and other trend tracking strategies, this strategy can better capture turning points. Compared with a single stop loss method, this dynamic ATR stop loss can be more flexible. Therefore, this strategy overall has a good risk-reward ratio.
This strategy relies mainly on technical indicators, if the indicators give wrong signals, it may lead to losses due to reverse operations. Also in sideways markets, stop loss may be frequently triggered, resulting losses.
In addition, although the ATR stop loss can adjust the stop level based on volatility, it cannot completely avoid the probability of stop loss being penetrated. If there is a price gap, the stop loss order may be triggered directly.
This strategy can be optimized in the following aspects:
-
Adjust indicator parameters to improve the accuracy of trading signals, e.g. test different parameter Stochastic indicators, or adjust the ATR period and multiplier parameters of the Supertrend indicator.
-
Test the effect of other stop loss methods, such as more flexible adaptive intelligent stop loss algorithms, or consider trailing stop loss.
-
Increase filters and only take high-conviction signals, e.g. add indicators like trading volume, to avoid wrong entry when volume is insufficient.
-
Optimize money management strategies such as dynamically adjusting position size.
The Stochastic Supertrend tracking stop loss trading strategy combines multiple indicators to determine trend direction and adopts intelligent ATR tracking to control risks. This strategy can effectively filter noise and has good risk-reward ratio. We can continuously optimize this strategy by adjusting parameters, modifying stop loss methods and adding filters to adapt to more complex market environments.
[/trans]
Strategy Arguments
| Argument | Default | Description |
|---|---|---|
| v_input_1 | 10 | ATR Length |
| v_input_float_1 | 3 | Factor |
| v_input_int_1 | 14 | length k% |
| v_input_int_2 | 3 | smoothing k% |
| v_input_int_3 | 3 | smoothing d% |
| v_input_int_4 | 12 | Length |
| v_input_string_1 | 0 | Smoothing: SMA |
| v_input_2 | 1.5 | Multiplier |
| v_input_3_high | 0 | src1: high |
| v_input_4_low | 0 | src2: low |
| v_input_5 | true | Show Price Lines |
| v_input_6 | blue | ATR Text Color |
| v_input_7 | teal | Low Text Color |
| v_input_8 | red | High Text Color |
| v_input_9 | teal | Low Line Color |
| v_input_10 | red | High Line Color |
Source (PineScript)
/*backtest
start: 2024-01-01 00:00:00
end: 2024-01-24 00:00:00
period: 1h
basePeriod: 15m
exchanges: [{"eid":"Futures_Binance","currency":"BTC_USDT"}]
*/

// This source code is subject to the terms of the Mozilla Public License 2.0 at https://mozilla.org/MPL/2.0/
// © araamas

//@version=5
strategy("stoch supertrd atr 200ma", overlay=true, process_orders_on_close=true)
var B = 0
if strategy.position_size > 0 //to figure out how many bars away did buy order happen
    B += 1

if strategy.position_size == 0
    B := 0

atrPeriod = input(10, "ATR Length")
factor = input.float(3.0, "Factor", step = 0.01)

[supertrend, direction] = ta.supertrend(factor, atrPeriod)

bodyMiddle = plot((open + close) / 2, display=display.none)
upTrend = plot(direction < 0 ? supertrend : na, "Up Trend", color = color.green, style=plot.style_linebr)
downTrend = plot(direction < 0? na : supertrend, "Down Trend", color = color.red, style=plot.style_linebr)

ema = ta.ema(close, 200)
plot(ema, title="200 ema", color=color.yellow)

b = input.int(defval=14, title="length k%")
d = input.int(defval=3, title="smoothing k%")
s = input.int(defval=3, title="smoothing d%")
smooth_k = ta.sma(ta.stoch(close, high, low, b), d)
smooth_d = ta.sma(smooth_k, s)

////////////////////////////////////////////////////////////////////////////////
length = input.int(title="Length", defval=12, minval=1)
smoothing = input.string(title="Smoothing", defval="SMA", options=["RMA", "SMA", "EMA", "WMA"])
m = input(1.5, "Multiplier")
src1 = input(high)
src2 = input(low)
pline = input(true, "Show Price Lines")
col1 = input(color.blue, "ATR Text Color")
col2 = input(color.teal, "Low Text Color",inline ="1")
col3 = input(color.red, "High Text Color",inline ="2")

collong = input(color.teal, "Low Line Color",inline ="1")
colshort = input(color.red, "High Line Color",inline ="2")

ma_function(source, length) =>
	if smoothing == "RMA"
		ta.rma(source, length)
	else
		if smoothing == "SMA"
			ta.sma(source, length)
		else
			if smoothing == "EMA"
				ta.ema(source, length)
			else
				ta.wma(source, length)

a = ma_function(ta.tr(true), length) * m
x = ma_function(ta.tr(true), length) * m + src1
x2 = src2 - ma_function(ta.tr(true), length) * m

p1 = plot(x, title = "ATR Short Stop Loss", color=color.blue)
p2 = plot(x2, title = "ATR Long Stop Loss", color= color.blue)


///////////////////////////////////////////////////////////////////////////////////////////////

shortCondition = high < ema and direction == 1 and smooth_k > 80
if (shortCondition) and strategy.position_size == 0
    strategy.entry("sell", strategy.short)

longCondition = low > ema and direction == -1 and smooth_k < 20
if (longCondition) and strategy.position_size == 0
    strategy.entry("buy", strategy.long)

g = (strategy.opentrades.entry_price(0)-x2) * 2
k = (x - strategy.opentrades.entry_price(0)) * 2

if strategy.position_size > 0
    strategy.exit(id="buy exit", from_entry="buy",limit=strategy.opentrades.entry_price(0) + g, stop=x2)

if strategy.position_size < 0
    strategy.exit(id="sell exit", from_entry="sell",limit=strategy.opentrades.entry_price(0) - k, stop=x)

//plot(strategy.opentrades.entry_price(0) - k, color=color.yellow)
//plot(strategy.opentrades.entry_price(0) + g, color=color.red)
Detail
https://www.fmz.com/strategy/439997
Last Modified
2024-01-25 16:04:39