Name
VWAP和RSI组合策略VWAP-and-RSI-Combination-Strategy
Author
ChaoZhang
Strategy Description
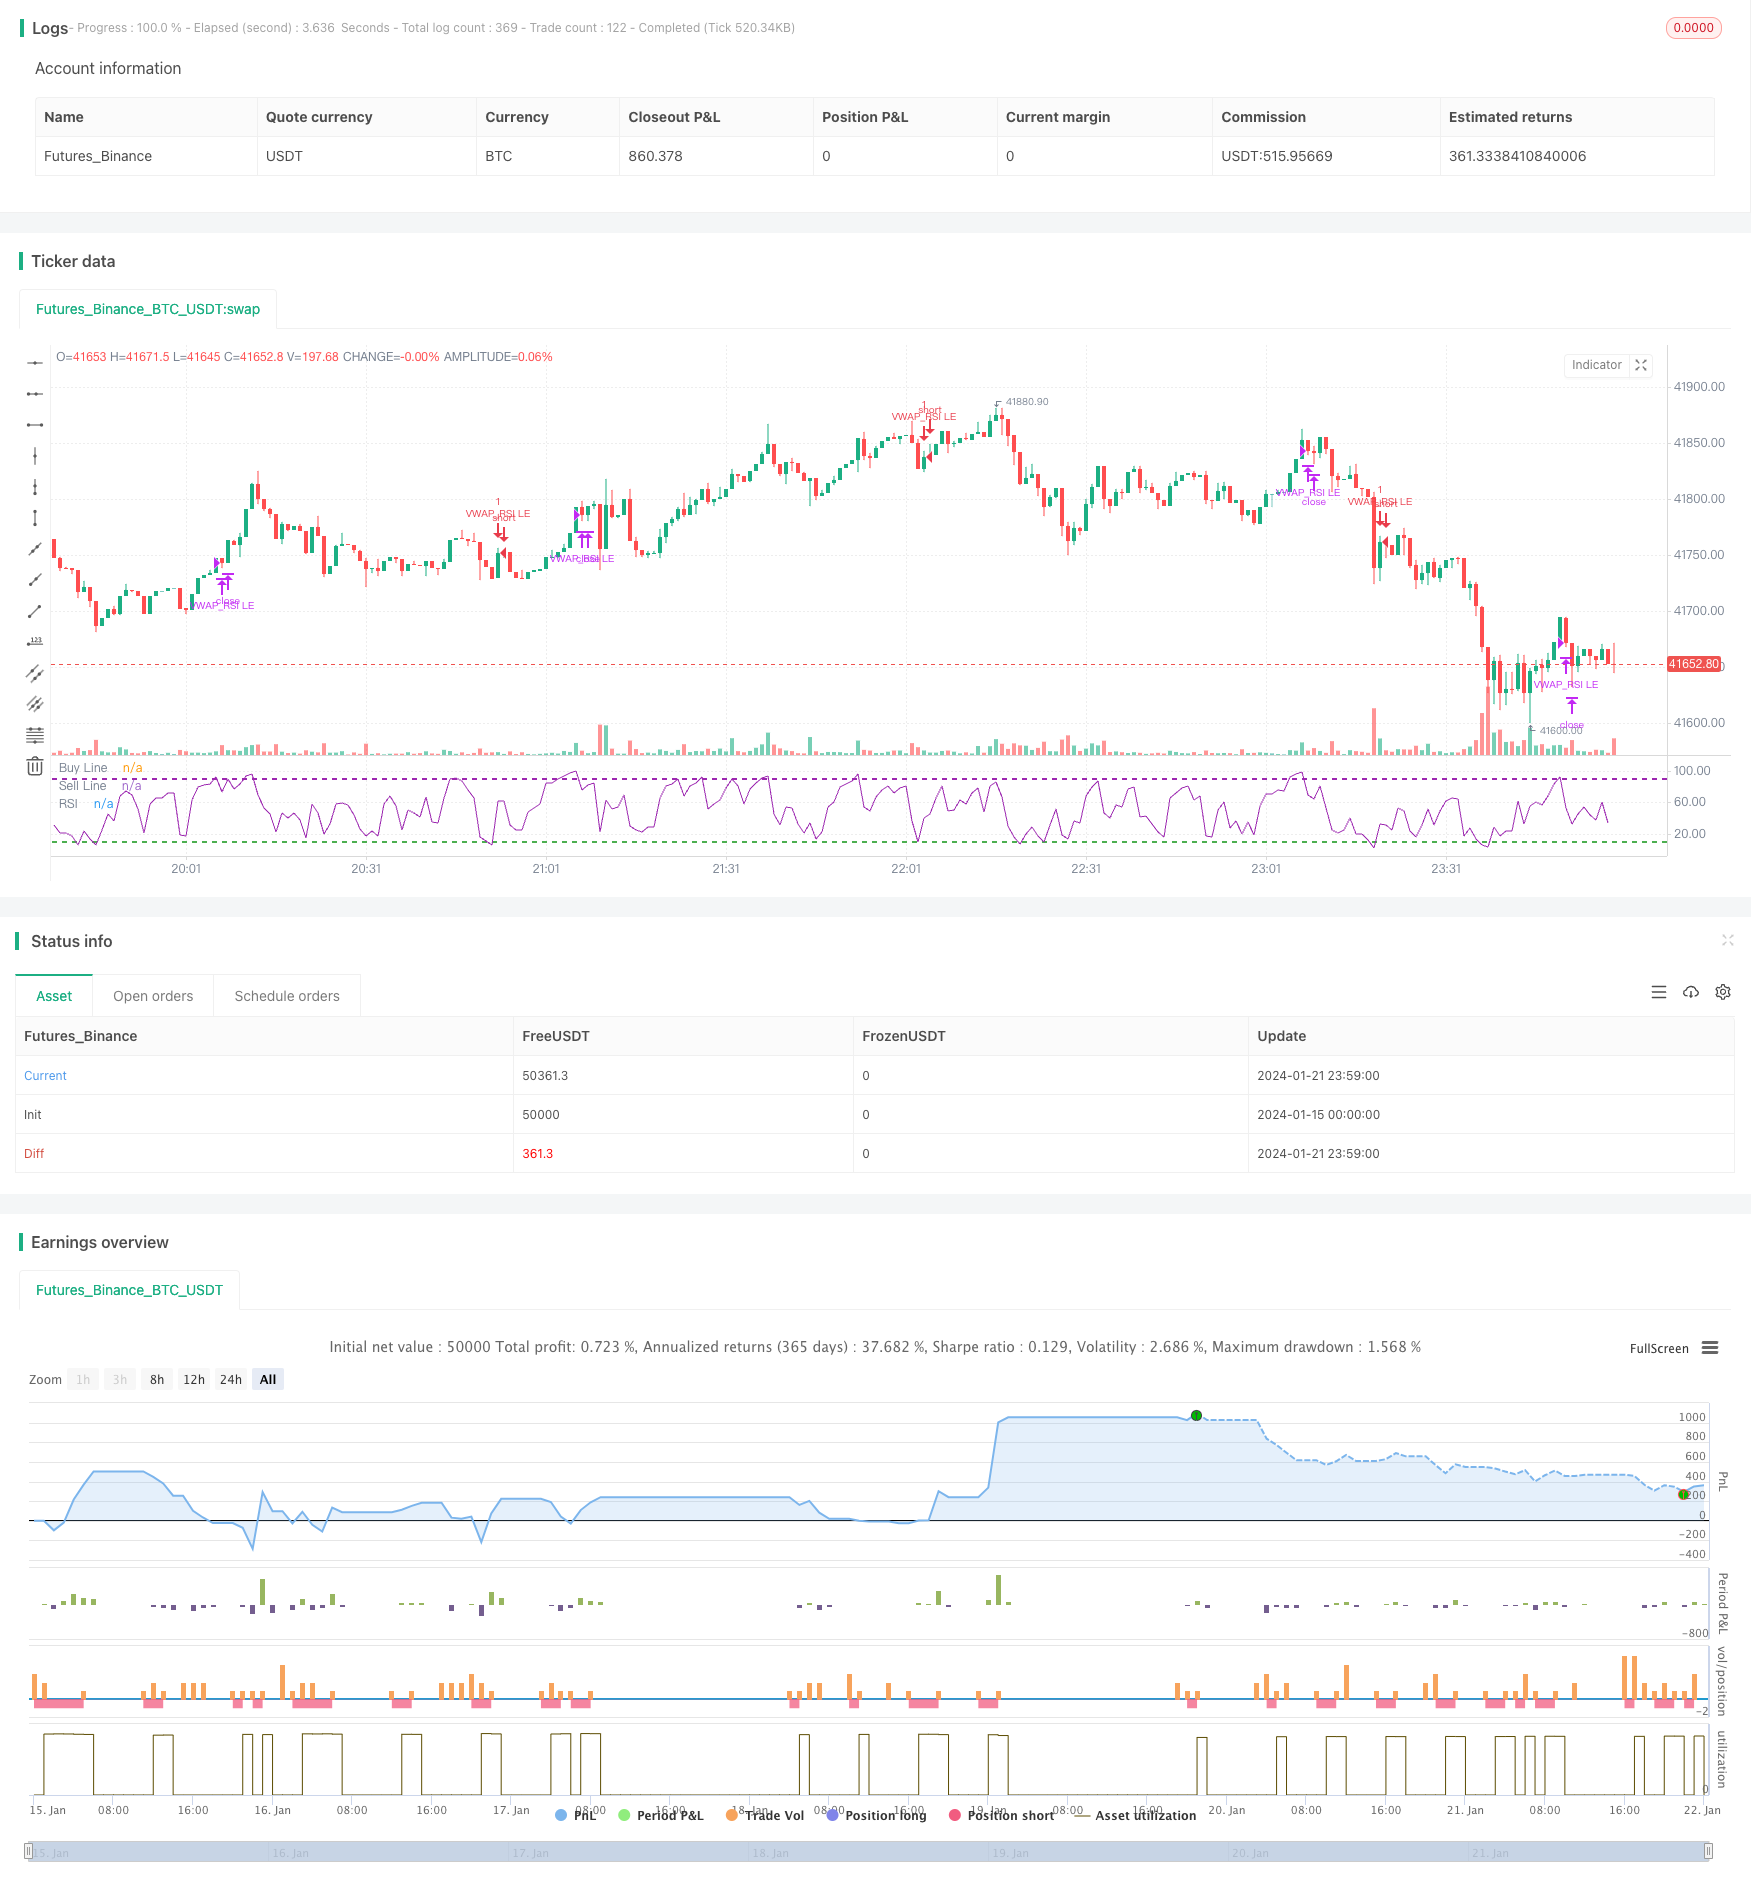
本策略名称为“跟踪型价值加权平均价与相对强弱指标组合策略”。该策略运用价值加权平均价(VWAP)和相对强弱指数(RSI)两个指标,实现了趋势追踪进入与超买超卖退出的组合策略。
该策略的交易逻辑主要基于以下几点:
- 使用50日指数移动平均线从上突破200日线作为判断行情向上的信号
- 当收盘价高于该交易日的VWAP价值,并且收盘价高于开盘价时,认为行情走强,可以入场
- 如果前10根K线中,RSI指标有至少一根K线低于10,则视为超卖形态,是一个强力的入场信号
- 当RSI指标再次向下交叉90这一超买区域时,选择退出场外
- 设定5%的止损线,避免损失过大
以上就是该策略的基本交易逻辑。通过EMA判断大趋势,VWAP判断当日趋势,RSI判断超买超卖区域,实现了多种指标的有效结合,既确保了交易的主方向正确,又增加了入场和退出的信号效果。
该策略最大的优势在于指标的组合使用。单一的VWAP并不能完美应对所有的市场情况,此时引入RSI的辅助,可以识别一些短期的超卖突破点位带来的交易机会。另外,EMA的应用也使得只有大周期向上的行情才选择入场,避免被短期调整反转所套牢。
这种组合指标的使用方式也增加了策略的稳定性。在RSI出现一两次假突破的情况下,还有VWAP和EMA做后盾,不大可能产生错误交易。同理,当VWAP产生假突破时,也有RSI指标的确认。所以这种组合使用大大提高了策略实施的成功率。
该策略的主要风险在于VWAP指标的使用。VWAP代表当日的平均成交价格,但是并不是每一天的价格波动都围绕VWAP上下波动。所以VWAP突破的信号不一定能确保后市的价格真的可以持续突破。当出现伪突破时可能造成交易上的亏损。
此外,RSI指标容易产生分歧口。当市场处于震荡盘整阶段时,RSI可能来回触及多次超买超卖区域,造成交易信号的频繁输出。这种情况下,如果盲目跟随RSI信号进行交易,也会面临一定的风险。
对此,我们在策略中采用EMA指数移动平均线作为大周期判断,只在大周期向上时考虑交易,这可以一定程度上避免上述两个问题对策略造成的影响。此外设定止损线,也可以使单次亏损控制在一定范围内。
该策略还有进一步优化的空间,主要集中在以下几个方面:
-
引入更多指标进行组合。比如卡尔曼均线,布林带等,使交易信号更加清晰可靠。
-
对交易费用进行优化。现有策略没有考虑手续费的影响,可以结合真实交易账户,对开仓数目大小进行优化。
-
调整止损模型。现有的止损方式较为简单,无法完美契合市场变化。可以测试移动止损,追踪止损等方式。
-
测试不同品种的应用效果。目前仅在标普和纳指这两个指数上测试。可以扩大样本区间,找到最匹配该策略品种。
本策略综合利用EMA、VWAP和RSI三个指标的优势,实现了趋势追踪和超买超卖的有效组合,能够在大周期向上和短期调整中均能找到合理的入场时机,并具有较强的稳定性。同时,策略优化空间较大,有望通过引入更多指标、调整止损方式等手段进一步提高策略胜率和盈利水平。
||
The strategy is named "Value Weighted Average Price and Relative Strength Index Combination Strategy". It utilizes the Value Weighted Average Price (VWAP) and Relative Strength Index (RSI) indicators to implement a combination strategy of trend following entry and overbought oversold exit.
The main logic of this strategy is based on the following points:
- Use the 50-day exponential moving average crossing above the 200-day line as a signal that the market trend is up.
- When the closing price is higher than the VWAP price of the day, and the closing price is higher than the opening price, it is considered that the market is going stronger and can enter the market.
- If the RSI indicator on at least one of the previous 10 K-lines is lower than 10, it is regarded as an oversold formation and a strong entry signal.
- When the RSI indicator crosses down the overbought area of 90 again, exit the market.
- Set a 5% stop loss to avoid excessive losses.
The above is the basic trading logic of this strategy. EMA judges the big trend, VWAP judges the daily trend, RSI judges the overbought and oversold area to achieve effective combination of multiple indicators, which ensures the correct direction of the main trading while increasing entry and exit signals.
The biggest advantage of this strategy is the combination use of indicators. The single VWAP cannot perfectly cope with all market conditions. At this time, with the help of RSI, some short-term oversold breakthrough opportunities can be identified. In addition, the application of EMA also ensures that only long-cycle upward trends are selected, avoiding being trapped by short-term reversals.
This way of using combined indicators also increases the stability of the strategy. In the case of one or two false breakouts of the RSI, there are still VWAP and EMA for backup, and it is unlikely to make wrong trades. Similarly, when VWAP has false breakouts, there is also confirmation from RSI indicators. Therefore, this combination usage greatly improves the success rate of strategy implementation.
The main risk of this strategy lies in the use of the VWAP indicator. VWAP represents the average transaction price of the day, but not every day's price fluctuation fluctuates around VWAP. Therefore, VWAP breakout signals do not necessarily ensure that prices can continue to break through afterwards. Pseudo breakouts may cause losses in transactions.
In addition, RSI indicators are prone to have divergences. When the market is in a shock consolidation phase, the RSI may repeatedly touch the overbought and oversold zones multiple times, resulting in frequent output of trading signals. In this case, blindly following RSI signals for trading also faces certain risks.
To address this issue, we use the EMA exponential moving average as a large cycle judgment in the strategy, only considering trading when the large cycle is upward, which can alleviate the impact of the above two issues on the strategy to some extent. In addition, setting a stop loss can also keep a single loss within a certain range.
There is still room for further optimization of this strategy, mainly in the following aspects:
-
Introduce more indicators for combination. Such as Kalman lines, Bollinger bands, etc., to make trading signals clearer and more reliable.
-
Optimize transaction costs. The existing strategy does not consider the impact of fees and commissions. It can be combined with real trading accounts to optimize the size of the number of open positions.
-
Adjust the stop loss model. The existing stop loss method is relatively simple and cannot perfectly match market changes. Moving stop loss, tracking stop loss and other methods can be tested.
-
Test the application effects of different varieties. Currently only tested on the S&P 500 and Nasdaq indices. The sample range can be expanded to find the varieties that best match this strategy.
This strategy integrates the advantages of EMA, VWAP and RSI indicators to achieve effective combination of trend tracking and overbought oversold signals, which can find reasonable entry opportunities both in big cycle ups and short-term adjustments. At the same time, the strategy has considerable room for optimization, and it is promising to further improve the win rate and profit level of the strategy through introducing more indicators, adjusting stop loss methods, etc.
[/trans]
Strategy Arguments
| Argument | Default | Description |
|---|---|---|
| v_input_1 | 200 | Long EMA |
| v_input_2 | 50 | short EMA |
| v_input_3 | 3 | RSI Period |
| v_input_4 | 10 | RSI Buy Line |
| v_input_5 | 90 | RSI Sell Line |
| v_input_6 | 5 | Stop Loss% |
Source (PineScript)
/*backtest
start: 2024-01-15 00:00:00
end: 2024-01-22 00:00:00
period: 1m
basePeriod: 1m
exchanges: [{"eid":"Futures_Binance","currency":"BTC_USDT"}]
*/

// This source code is subject to the terms of the Mozilla Public License 2.0 at https://mozilla.org/MPL/2.0/
// © mohanee

//@version=4
strategy(title="VWAP and RSI strategy [EEMANI]", overlay=false)
//This strategy combines VWAP and RSI indicators
//BUY RULE
//1. EMA50 > EMA 200
//2. if current close > vwap session  value and  close>open
//3. check if RSI3 is dipped below 10  for any of last 10 candles
//EXIT RULE
//1. RSI3   crossing down 90 level
//STOP LOSS EXIT
//1. As configured --- default is set to 5%


// variables  BEGIN

longEMA = input(200, title="Long EMA", minval=1)
shortEMA = input(50, title="short EMA", minval=1)

rsi1 = input(3,title="RSI Period", minval=1)
rsi_buy_line = input(10,title="RSI Buy Line", minval=5)
rsi_sell_line = input(90,title="RSI Sell Line", minval=50)

stopLoss = input(title="Stop Loss%", defval=5, minval=1)

//variables  END


longEMAval= ema(close, longEMA)
shortEMAval= ema(close, shortEMA)
rsiVal=rsi(close,rsi1)
vwapVal=vwap(hlc3)


// Drawings

plot_rsi = plot(rsiVal, title="RSI", color=color.purple, linewidth=1)
//plot_fill = plot(0, color=color.green, editable=false)
//fill(plot_rsi, plot_fill, title="Oscillator Fill", color=color.blue, transp=75)
hline(rsi_buy_line, color=color.green, title="Buy Line", linewidth=2, linestyle=hline.style_dashed)
hline(rsi_sell_line, color=color.purple, title="Sell Line", linewidth=2, linestyle=hline.style_dashed)
//plot(value_ma, title="MA", color=color_ma, linewidth=2)

longCondition=  shortEMAval > longEMAval and  close>open and  close>vwapVal
rsiDipped =  rsiVal[1]<rsi_buy_line or rsiVal[2]<rsi_buy_line or rsiVal[3]<rsi_buy_line  or rsiVal[4]<rsi_buy_line  or rsiVal[5]<rsi_buy_line  or rsiVal[6]<rsi_buy_line or rsiVal[7]<rsi_buy_line  or rsiVal[8]<rsi_buy_line  or rsiVal[9]<rsi_buy_line  or rsiVal[10]<rsi_buy_line

//Entry
strategy.entry(id="VWAP_RSI LE", comment="VR LE" , long=true,  when= longCondition and rsiDipped )

//Take profit Exit
strategy.close(id="VWAP_RSI LE", comment="TP Exit",   when=crossunder(rsiVal,90) )


//stoploss
stopLossVal =   strategy.position_avg_price -  (strategy.position_avg_price*stopLoss*0.01)
strategy.close(id="VWAP_RSI LE", comment="SL Exit",   when= close < stopLossVal)
Detail
https://www.fmz.com/strategy/439745
Last Modified
2024-01-23 14:37:22