It's very hard to test this locally because the font / text styling changes between the local version and the server.
I'm currently controlling the alignment by changing the height of the gene labels image according to the number of genes, e.g. height = function() 28.5 + 29 * length(input_new()$gene) (this is the form of the function when I took the screenshots below). I would like to find a better way to do this, perhaps with plot_grid while still preserving the hover locations on the dendrogram.
Interestingly, after some adjustments that I made previously, the alignment is better when more genes are plotted and not for a few genes. (See screenshots below)
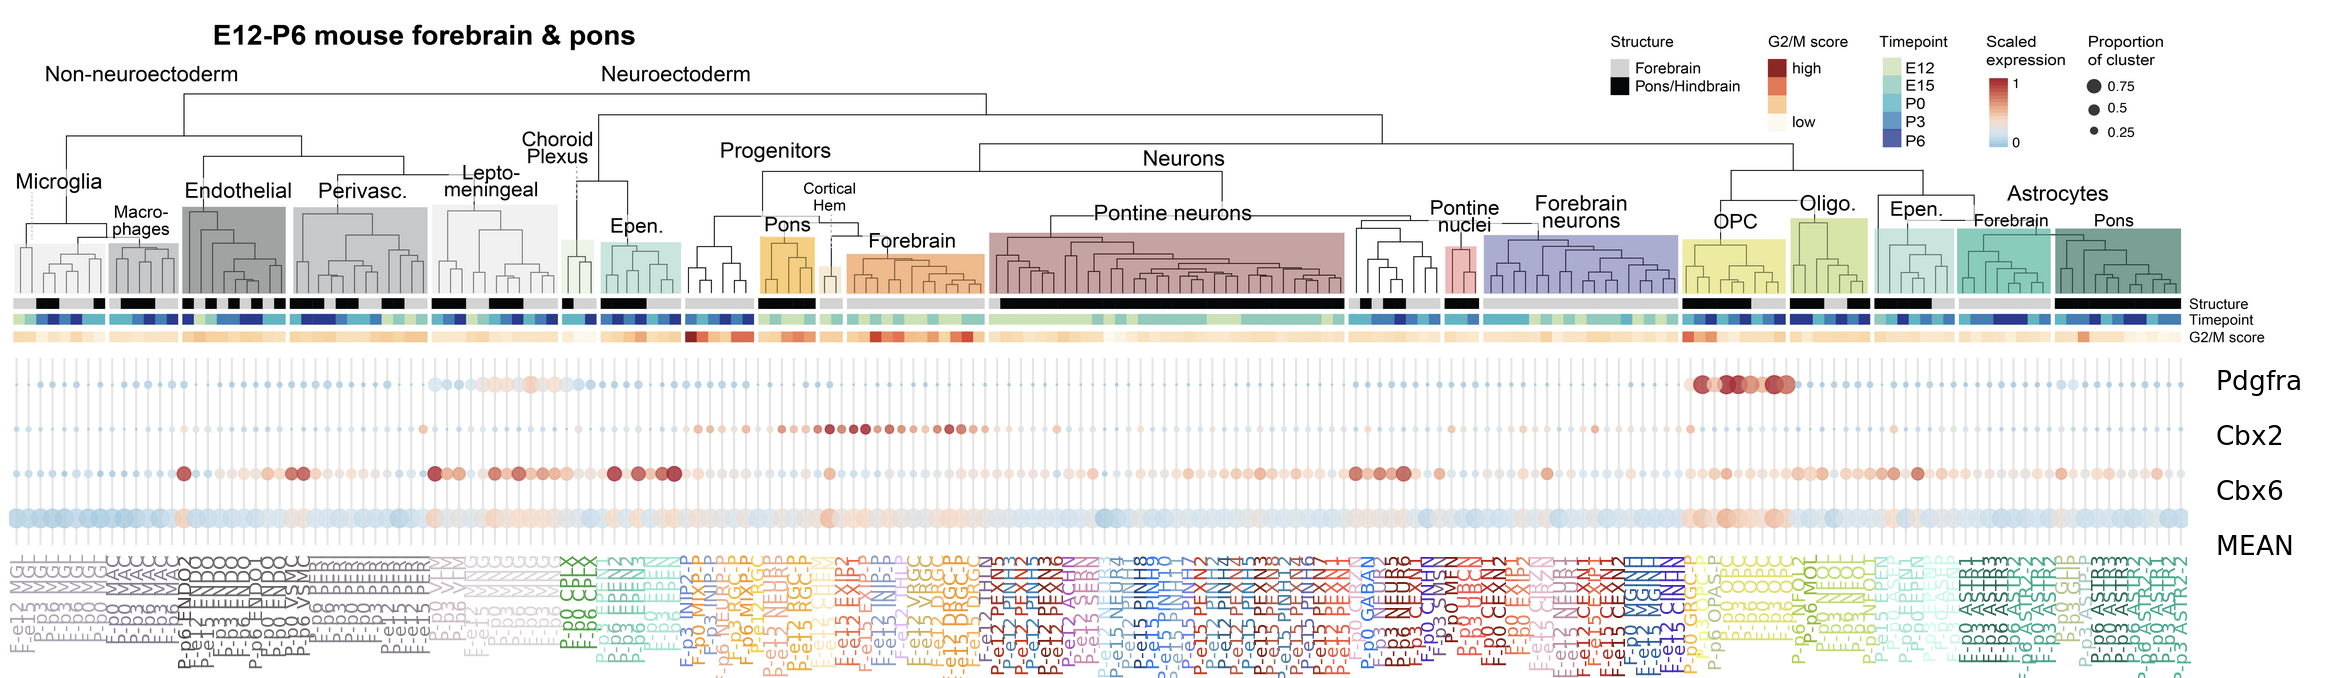
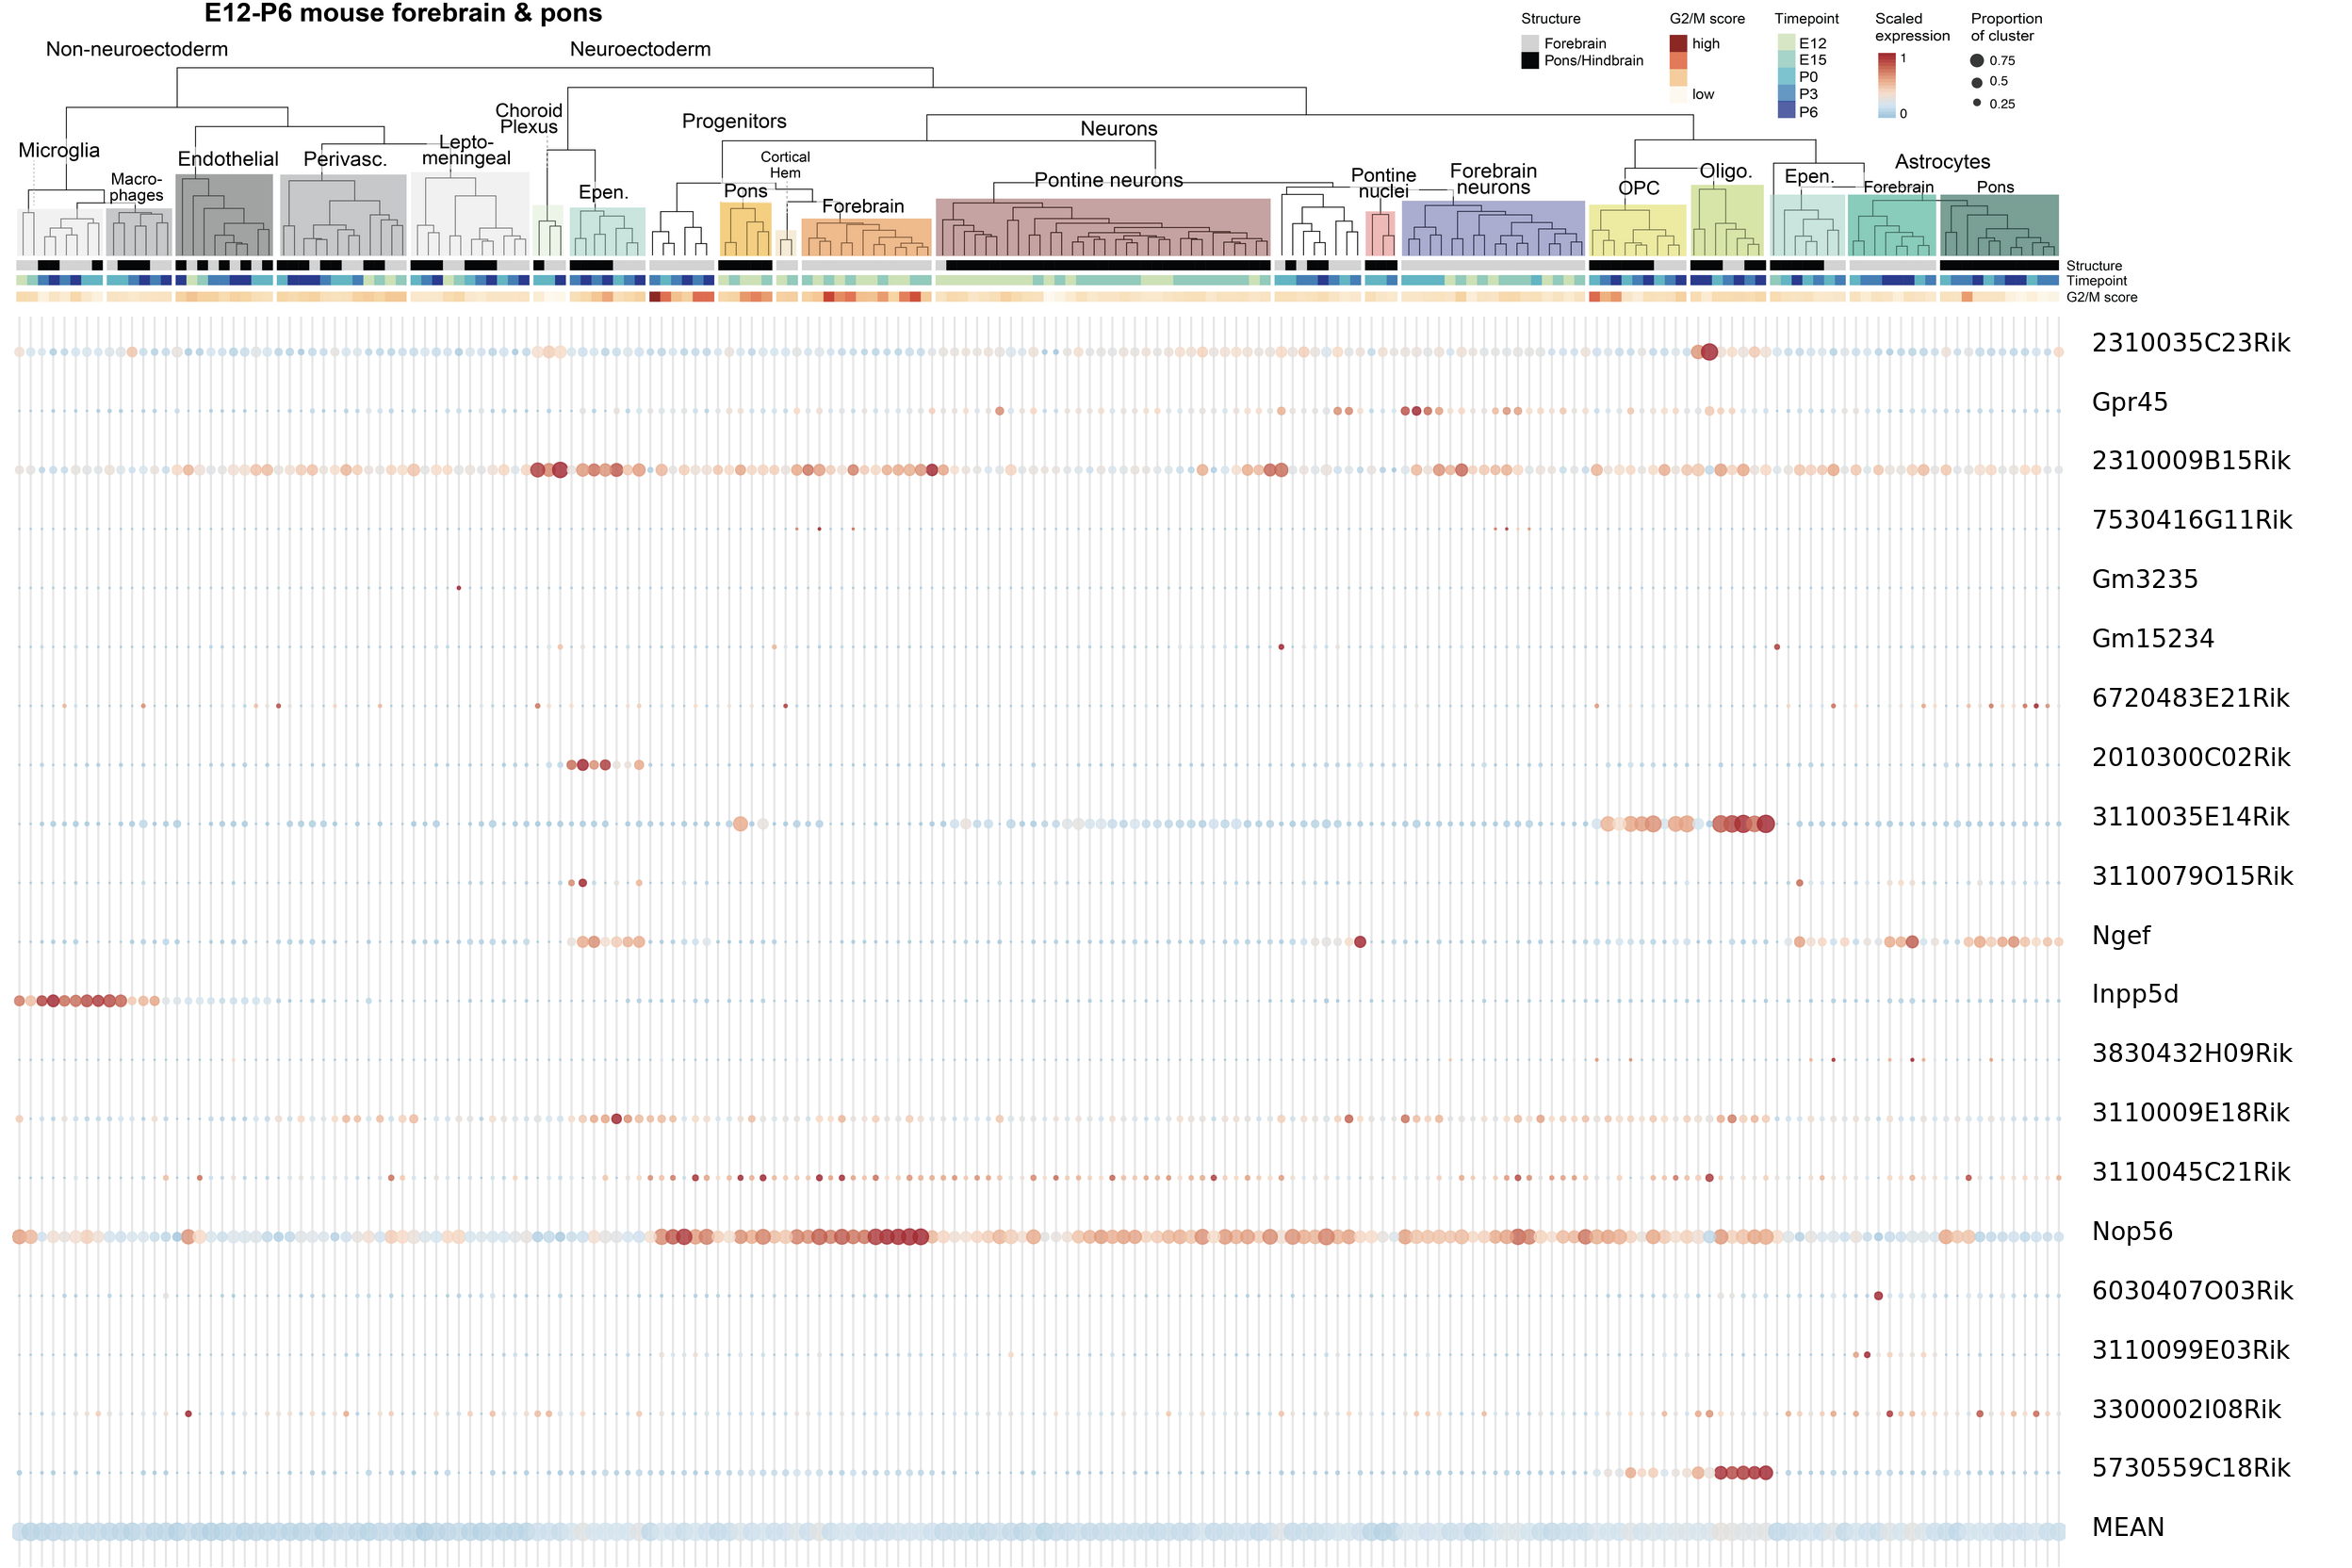

It's very hard to test this locally because the font / text styling changes between the local version and the server.
I'm currently controlling the alignment by changing the height of the gene labels image according to the number of genes, e.g.
height = function() 28.5 + 29 * length(input_new()$gene)(this is the form of the function when I took the screenshots below). I would like to find a better way to do this, perhaps with plot_grid while still preserving the hover locations on the dendrogram.Interestingly, after some adjustments that I made previously, the alignment is better when more genes are plotted and not for a few genes. (See screenshots below)