| description |
|---|
KDE |
{% content-ref url="../../../bfm-rins.-bi-fang-meng-ke-xue-yan-jiu-yuan/shu-ju-zhi-neng-bu/lv6-xing-mo-fang-fen-lei/" %} lv6-xing-mo-fang-fen-lei {% endcontent-ref %}
星魔方主要是做一个基于MVRV S2F NVT的三维分类器,暂时把数据简单归一化之后,再考虑输入历史数据中的“60天后收益”来归一化到决策仓位,用核密度估计法获得决策仓位在MVRV-S2F-NVT三维空间中的分布。
https://blog.csdn.net/weixin_42715356/article/details/82732207 机器学习总结之——线性分类器与非线性分类器
https://blog.csdn.net/qq_44872466/article/details/117334947 空间核密度分析
https://blog.csdn.net/qq_37148940/article/details/113545956 【思维导图】什么是核密度估计?知乎大神的回答整合
https://www.cnblogs.com/nxf-rabbit75/p/10422832.html kdeplot(核密度估计图) & distplot
https://www.cxymm.net/article/m0_37712157/84678398 核密度估计(kernel density estimation)kde_m0_37712157的博客-程序员秘密
https://www.cnpython.com/qa/130158 如何在多维/3D中实现核密度估计
https://blog.csdn.net/zhongkeyuanchongqing/article/details/114984734 核方法是什么?核密度估计是什么?核函数是什么?他们之间有什么关系?有多少种核函数?
https://wenku.baidu.com/view/5bb555c0a1c7aa00b52acbdc.html 密度核估计中核函数的迭代算法及对最优窗宽的研究
https://www.codetd.com/article/4195324 核模型(核密度估计)
https://cloud.tencent.com/developer/information/python%E6%A0%B8%E5%AF%86%E5%BA%A6%E5%9B%BE
https://www.pythonf.cn/read/134921 机器学习笔记11核密度估计,Python,KernelDensityEstimation
https://blog.csdn.net/lrs1353281004/article/details/106535592 从零开始实现核密度估计(kernel density estimation,KDE)-python实现
核密度估计(kernel density estimation)是在概率论中用来估计未知的密度函数,属于非参数检验方法之一,由Rosenblatt (1955)和Emanuel Parzen(1962)提出,又名Parzen窗(Parzen window)。 具体原理推导可参考这篇博客。 此篇博客侧重于根据理论公式,给出python实现。
信用业务风险度量 研究报告 http://mathfinance.sdu.edu.cn/__local/4/35/1A/FE611B7965EF95F3BC301CF8E93_7707220E_1E8C93.pdf?e=.pdf
核密度估计python,Python中的多变量内核密度估计https://blog.csdn.net/weixin_42523670/article/details/118901334
I am trying to use SciPy's gaussian_kde function to estimate the density of multivariate data. In my code below I sample a 3D multivariate normal and fit the kernel density but I'm not sure how to evaluate my fit.
import numpy as np
from scipy import stats
mu = np.array([1, 10, 20])
sigma = np.matrix([[4, 10, 0], [10, 25, 0], [0, 0, 100]])
data = np.random.multivariate_normal(mu, sigma, 1000)
values = data.T
kernel = stats.gaussian_kde(values)
I saw this but not sure how to extend it to 3D.
Also not sure how do I even begin to evaluate the fitted density? How do I visualize this?
解决方案
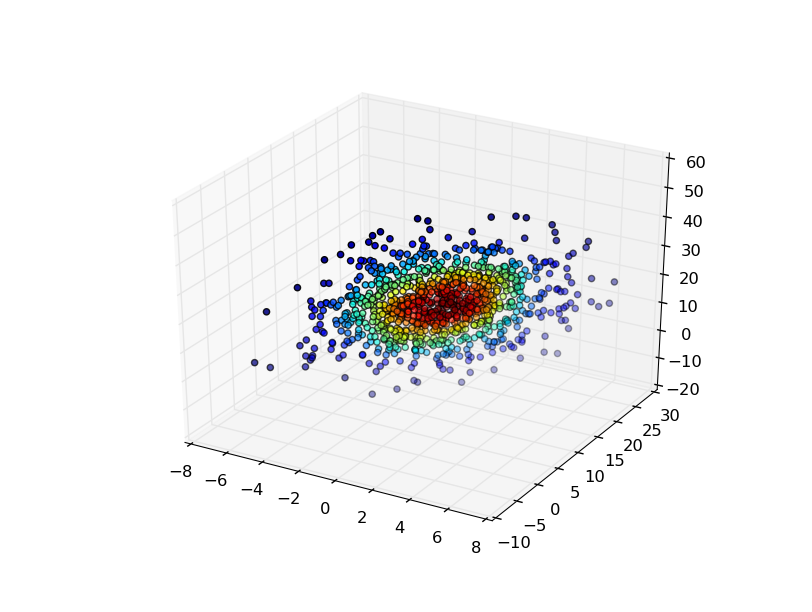
There are several ways you might visualize the results in 3D.
The easiest is to evaluate the gaussian KDE at the points that you used to generate it, and then color the points by the density estimate.
For example:
import numpy as np
from scipy import stats
import matplotlib.pyplot as plt
from mpl_toolkits.mplot3d import Axes3D

mu=np.array([1,10,20])

sigma=np.matrix([[4,10,0],[10,25,0],[0,0,100]])

data=np.random.multivariate_normal(mu,sigma,1000)

values = data.T

kde = stats.gaussian_kde(values)

density = kde(values)

fig, ax = plt.subplots(subplot_kw=dict(projection='3d'))

x, y, z = values

ax.scatter(x, y, z, c=density)

plt.show()
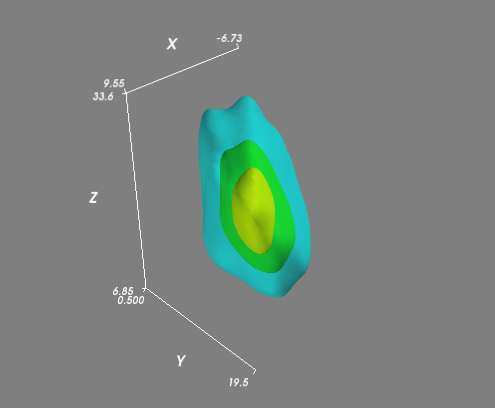
If you had a more complex (i.e. not all lying in a plane) distribution, then you might want to evaluate the KDE on a regular 3D grid and visualize isosurfaces (3D contours) of the volume. It's easiest to use Mayavi for the visualiztion:
import numpy as np
from scipy import stats
from mayavi import mlab
mu=np.array([1,10,20])
# Let's change this so that the points won't all lie in a plane...
sigma=np.matrix([[20,10,10],
[10,25,1],
[10,1,50]])
data=np.random.multivariate_normal(mu,sigma,1000)
values = data.T
kde = stats.gaussian_kde(values)
# Create a regular 3D grid with 50 points in each dimension
xmin, ymin, zmin = data.min(axis=0)
xmax, ymax, zmax = data.max(axis=0)
xi, yi, zi = np.mgrid[xmin:xmax:50j, ymin:ymax:50j, zmin:zmax:50j]
# Evaluate the KDE on a regular grid...
coords = np.vstack([item.ravel() for item in [xi, yi, zi]])
density = kde(coords).reshape(xi.shape)
# Visualize the density estimate as isosurfaces
mlab.contour3d(xi, yi, zi, density, opacity=0.5)
mlab.axes()
mlab.show()