⚠️ AI-generated draft — needs human validation
This issue was written by an AI agent from materials produced during the
hasadna Open Bus hackathon (July 2026). The underlying analysis was built fast,
under hackathon conditions, and has not been peer-reviewed. Figures,
endpoint behaviour and conclusions all need independent verification before
anyone acts on them or quotes them publicly.
Please validate before implementing. Corrections very welcome.
What it answers
The same zero-cancellations score, computed for every line of one operator and
ranked worst-first — so a company's weak lines are visible at a glance.
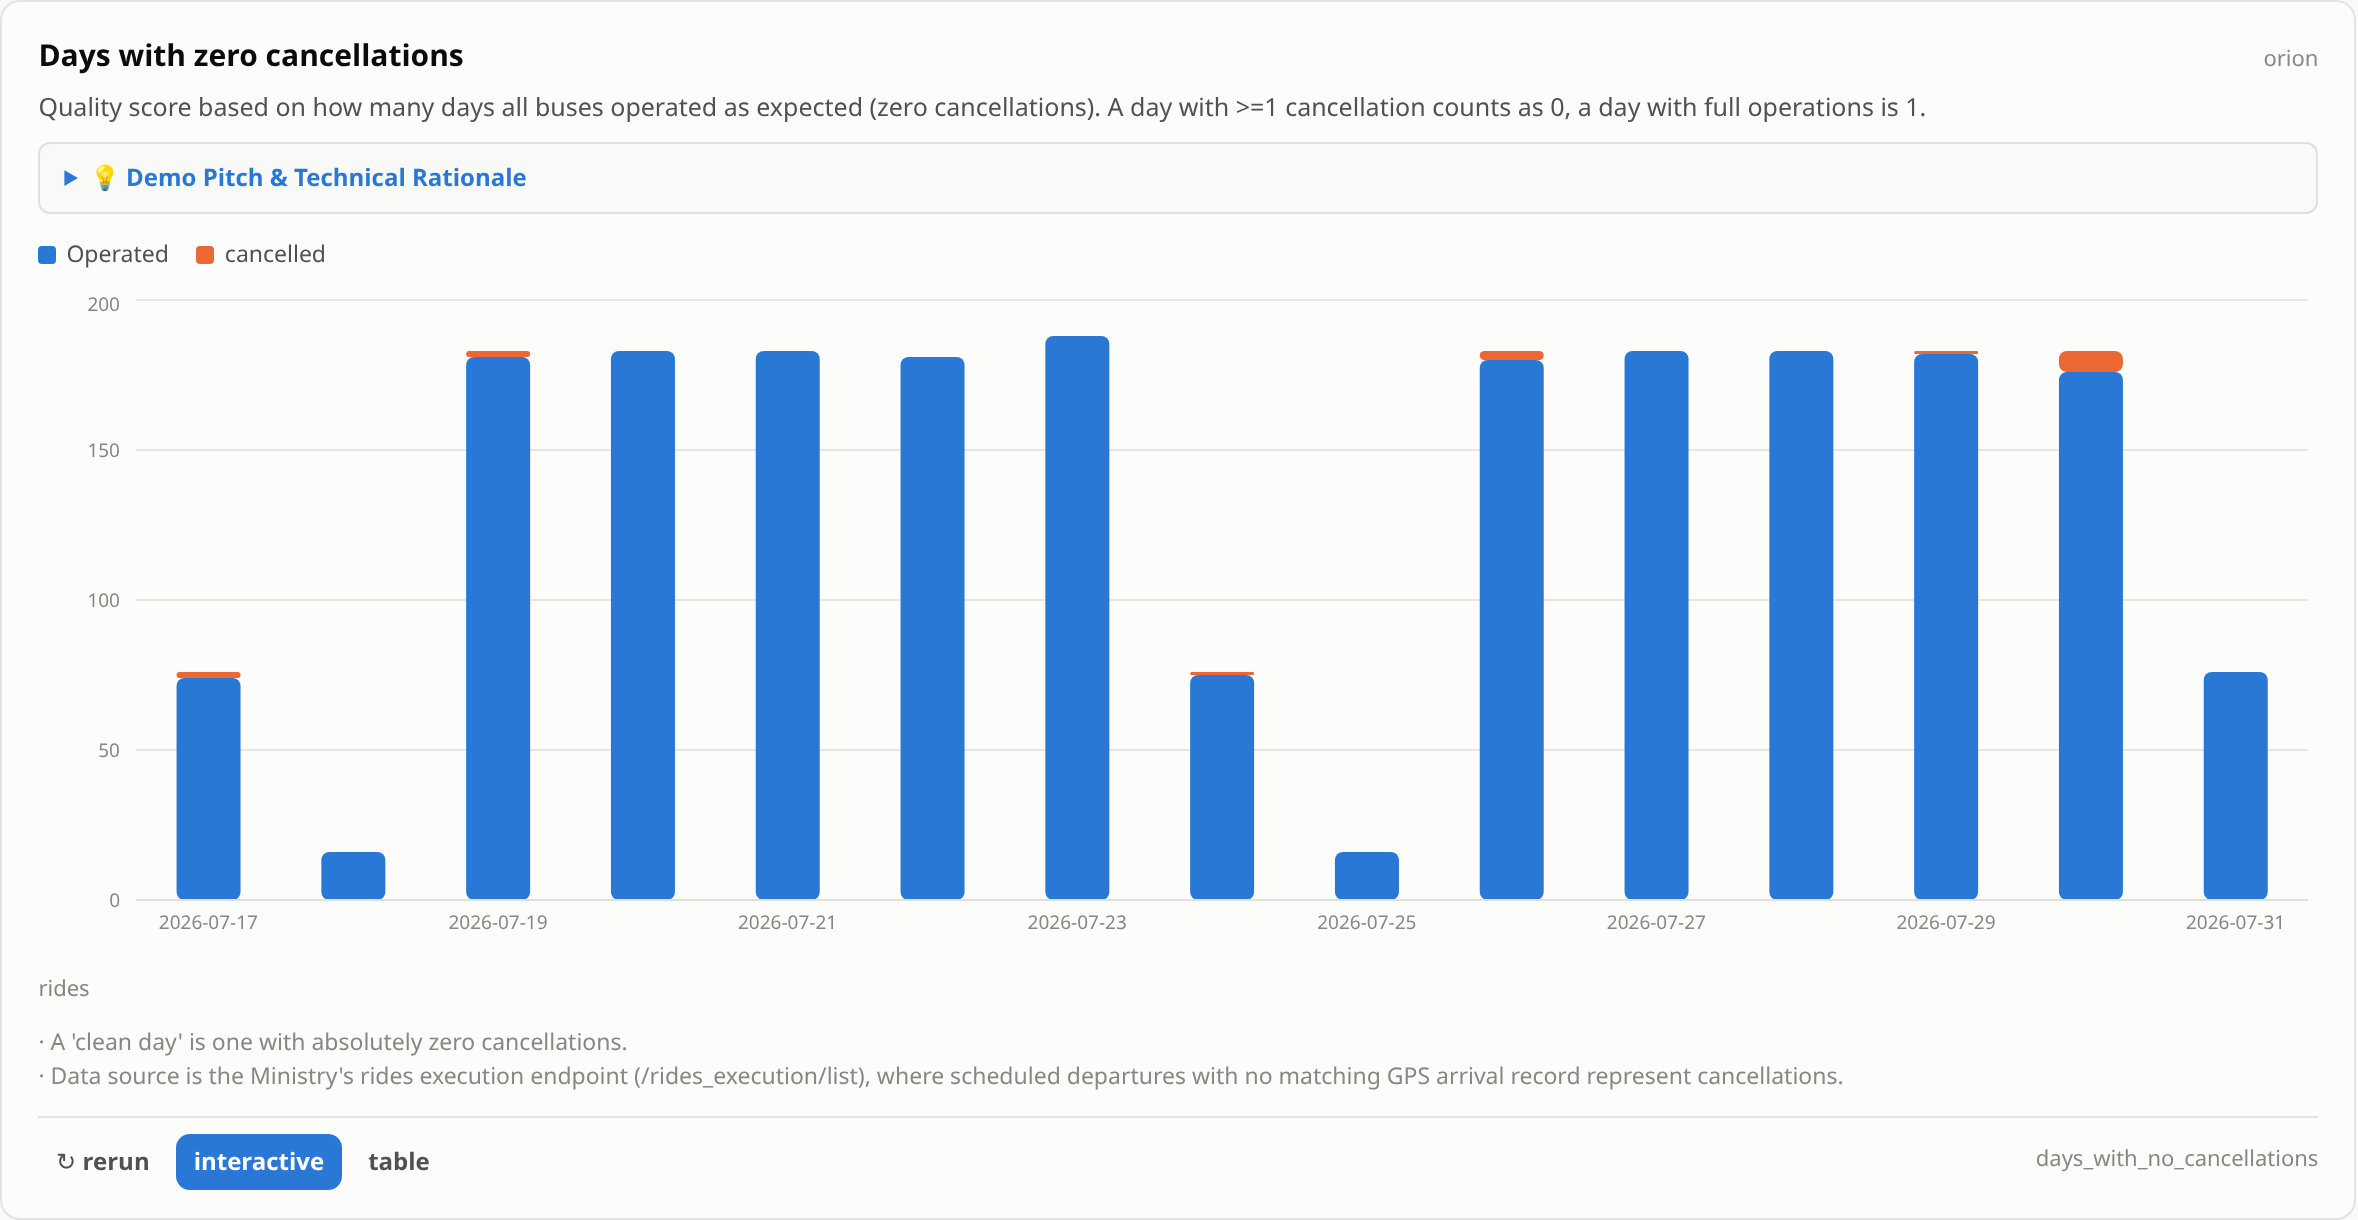
Days without cancellations, per line, for one operator — screenshot of the hackathon dashboard card.
How it works
Resolves every line_ref of the operator from /gtfs_routes/list, then runs the
per-line scoring for each. Lines whose entire window reports zero actuals are drawn
grey and hatched at 1.0 rather than scored 0.00 — that is an ingestion gap, not
a company that cancelled every bus it ever scheduled, and it must not be readable
as a score.
Where it could go in דאטאבוס
/operator — it is an operator-level summary and that page already exists for
exactly this kind of view.
A suggestion, not a decision — page ownership is the maintainers'.
Known limitations
Cost is the real constraint. One paged request per line_ref: ~80 for a small
company, ~1,240 for אגד. The hackathon card caps at 15 lines and sorts by name
length before truncating, which is an arbitrary selection presented as an operator
overview — a production version needs either pre-aggregation or a proper sampling
strategy.
Inherits the feed-outage ambiguity from the per-line version.
Suggested next steps
Build the cross-operator comparison — the original author specified this as
"method 3" and it was never built. Ranking operators against each other is the
comparison a regulator would actually want, and it is the natural endpoint of this
work.
Credit & provenance
Found during the hasadna Open Bus hackathon, July 2026 — analysis by Broundal.
· Method, evidence and caveats: algorithms/days-with-no-cancellations.md
· Original work: https://github.com/hasadna/open-bus-hackathon-26/tree/main/orion
· Issue drafts and the full defect list: algorithms/upstream-issues.md
What it answers
The same zero-cancellations score, computed for every line of one operator and
ranked worst-first — so a company's weak lines are visible at a glance.
Days without cancellations, per line, for one operator — screenshot of the hackathon dashboard card.
How it works
Resolves every
line_refof the operator from/gtfs_routes/list, then runs theper-line scoring for each. Lines whose entire window reports zero actuals are drawn
grey and hatched at 1.0 rather than scored 0.00 — that is an ingestion gap, not
a company that cancelled every bus it ever scheduled, and it must not be readable
as a score.
Where it could go in דאטאבוס
/operator— it is an operator-level summary and that page already exists forexactly this kind of view.
A suggestion, not a decision — page ownership is the maintainers'.
Known limitations
Cost is the real constraint. One paged request per
line_ref: ~80 for a smallcompany, ~1,240 for אגד. The hackathon card caps at 15 lines and sorts by name
length before truncating, which is an arbitrary selection presented as an operator
overview — a production version needs either pre-aggregation or a proper sampling
strategy.
Inherits the feed-outage ambiguity from the per-line version.
Suggested next steps
Build the cross-operator comparison — the original author specified this as
"method 3" and it was never built. Ranking operators against each other is the
comparison a regulator would actually want, and it is the natural endpoint of this
work.
Credit & provenance
Found during the hasadna Open Bus hackathon, July 2026 — analysis by Broundal.
· Method, evidence and caveats:
algorithms/days-with-no-cancellations.md· Original work: https://github.com/hasadna/open-bus-hackathon-26/tree/main/orion
· Issue drafts and the full defect list:
algorithms/upstream-issues.md