
-
Add Xdebug Helper on your browser (Firefox or Chrome)
-
Install PHP
-
Install PHP Xdebug : If Windows OS download Xdebug.dll put it in Xampp *.dll file path , normally in C:\Xampp\php\ext
-
Configure xdebug in php.ini file and add these lines : \
For v3.x
[xdebug]
zend_extension=xdebug.so
export XDEBUG_SESSION=STDIDE
xdebug.mode=debug
xdebug.client_host=site.dev.domain.local
xdebug.client_port=9003
xdebug.remote_handler=dbgp
xdebug.idekey=STDIDE
xdebug.default_enable=true
xdebug.start_with_request=yes
xdebug.log = "/var/log/xdebug.log"
For v2.x:
[xdebug]
;zend_extension = "/path/to/xdebug.so or /path/to/xdebug.dll"
zend_extension="C:\xampp\php\ext\php_xdebug.dll"
xdebug.remote_enable=true
xdebug.remote_host=localhost
xdebug.remote_port=9000
xdebug.remote_handler=dbgp
xdebug.idekey=STDIDE
; Optional Configuration
; Show stacktraces?
xdebug.default_enable=true
xdebug.remote_autostart =true
xdebug.remote_log = "C:\xampp\tmp\xdebug.txt"
xdebug.profiler_enable= 1;
xdebug.profiler_output_dir= "C:\xampp\tmp"- Configure your IDE (XDebug Client)
PHPStorm

Languages & Frameworks > Setting > php > Debug :
XDebug :
  Debug port : 9000
  Host : localhost # same as xdebug.remote_host=localhost
Languages & Frameworks > Setting > php > Debug > DBGp Proxy :
  IDE Key : STDIDE
  Host : localhost
  Port : 9000
Languages & Frameworks > Setting > php > Servers :
  Project Files: /path/to/project
  Host : localhost
  Port : 80
  Debugger : Xdebug
Optional alternative in phpstorm
Settings > Interpreters > PHP :
Name : PHP
PHP Executable : /path/to/bin/php # maybe /usr/bin/php
Debugger Extension : /path/to/xdebug(.so|.dll)
VS Code

- Install php-debug plugin by Felix Becker
- Generate launch.json by adding run configuration in your project opened in vscode. For more informations, see how to create a launch.json file for debugging in vscode
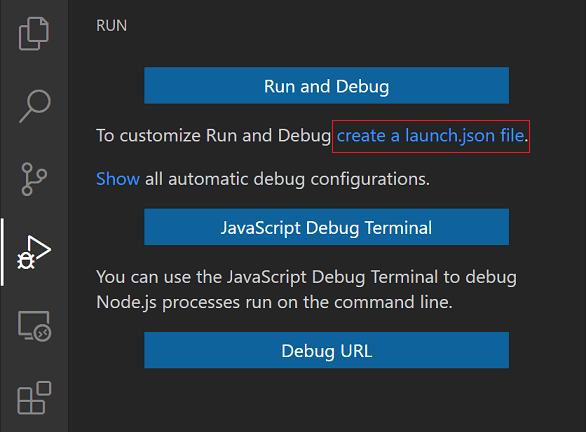
Your generated launch.json file may be like this:
    "version": "0.2.0",
    "configurations": [
        {
            "name": "Listen for XDebug",
            "type": "php",
            "request": "launch",
            "port": 9000
        },
        {
            "name": "Launch currently open script",
            "type": "php",
            "request": "launch",
            "program": "${file}",
            "cwd": "${fileDirname}",
            "port": 9000
        }
    ]
}
Note: If you use apache2 server, you should restart to work debugging properly. For VS Code, don't forget to check Allow Breakpoints Everywhere and AutoExpand Lazy Variable. You click on: File > Preferences > Settings > User(Tab) > Features > Debug \
Launching Xdebug:(For vscode only) Add launch.json file. Press F5 key to run Debugging for your IDE. And navigate to your link with XDEBUG_SESSION_START parameter on your url. For example: http://domain.name/api/url?XDEBUG_SESSION_START=IDEKEY . If your configuration isn't wrong, it should work. It start to debug at the first breakpoints you put.
- Run with Postman

# http://domain.name/api/url?XDEBUG_SESSION_START=IDEKEY
# Example
http://localhost:8000/apiusers?XDEBUG_SESSION_START=PHPSTORM
# In our case xdebug.idekey=STDIDE
http://localhost:8000/apiusers?XDEBUG_SESSION_START=STDIDE
- Let's create a sample project if everything are all rights
$ mkdir test-xdebug-project
$ cd test-xdebug-project
$ touch index.php
Add this content in index.php file
<?php
$a = 2;
$b = $a +2;
$a *= $b;

echo $a;
In your IDE, Add breakpoints for each line in index.php.
Click to "Start Debugging" IDE Button.
Run this command in your terminal
 # in test-xdebug-project folder
 $ php -S localhost:8080 -t .
Type this url in your browser.
http://localhost:8080
Note: If you are using virtualhost, don't forget this.
; update this line in your php.ini file
; Host name example: my.projectname.local
xdebug.remote_host=my.projectname.local
In your hosts file:
# in your hosts file : /etc/hosts
127.0.0.1 my.projectname.local
# Optional config (for vhosts server alias)
127.0.0.1 myprojectnamehost
In your virtualhost *.conf file:
# Example for my Symfony 4.4 project
<VirtualHost *:80>
    ServerAlias myprojectnamehost
    ServerName my.projectname.local
    SetEnv ENV dev
    # Authorization header : important for JWT for API based application
    #SetEnvIf Authorization "(.*)" HTTP_AUTHORIZATION=$1
    #Alias /back C:\Users\MyName\path\to\project\my.projectname.local\public
    DocumentRoot  C:\Users\MyName\path\to\project\my.projectname.local\public
    <Directory  C:\Users\MyName\path\to\project\my.projectname.local\public>
        DirectoryIndex index.php
        AllowOverride All
        Require all granted
        FallbackResource /index.php
    </Directory>
    ErrorLog C:\xampp-php7.4.14\apache\logs\my.projectname.local.error.log
    CustomLog C:\xampp-php7.4.14\apache\logs\my.projectname.local.access.log common
    # For Linux
    #ErrorLog /var/log/apache2/my.projectname.local.error.log
    #CustomLog /var/log/apache2/my.projectname.local.access.log common
</VirtualHost>
Type this url in your browser.
http://my.projectname.local
Note : If xdebug.remote_autostart=false, you may start xdebug session by adding XDEBUG_SESSION_START=STDIDE paramater in your url.
# Note : STDIDE : xdebug.idekey
http://my.projectname.local?XDEBUG_SESSION_START=STDIDE
For each url you access, you must always put this parameter to start xdebug session
# Another URL Example
http://my.projectname.local/api/users/add?XDEBUG_SESSION_START=STDIDE
Php execution may stopped at first breakpoint in index.php file.
If it's not working, verify your:
- Xdebug configuration in php.ini file(specially host and port,...)
- Xdebug port isn't used by another process.
- IDE configuration(launch.json in vscode). It must be same as your config in php.ini file
- php version used by your IDE
- Host configuration if you're using Virtualhost