pcm-sensor-server is a collector exposing Intel processor metrics over http in JSON or Prometheus (exporter text based) format. Also available as a docker container.
NEW: pcm-sensor-server is now supported on Windows! See Windows-specific instructions below.
Installation on target system to be analyzed:
- Build or download pcm tools
- As root, start pcm-sensor-server:
sudo ./pcm-sensor-serveror as non-root https://github.com/intel/pcm#executing-pcm-tools-under-non-root-user-on-linux
Alternatively one can start pcm-sensor-server as a container from docker hub.
Additional options:
$ ./pcm-sensor-server --help
Usage: ./pcm-sensor-server [OPTION]

Valid Options:
    -d                   : Run in the background (Linux/macOS only)
    -p portnumber        : Run on port <portnumber> (default port is 9738)
    -l|--listen address  : Listen on IP address <address> (default: all interfaces)
    -r|--reset           : Reset programming of the performance counters.
    -D|--debug level     : level = 0: no debug info, > 0 increase verbosity.
    -R|--real-time       : If possible the daemon will run with real time
                           priority, could be useful under heavy load to
                           stabilize the async counter fetching. (Linux only)
    -h|--help            : This information
The -l/--listen option allows you to specify which IP address the server should bind to. This is useful in multi-homed servers, containerized deployments, or restricted monitoring networks:
# Bind to localhost only (accessible only from the local machine)
sudo ./pcm-sensor-server -l 127.0.0.1 -p 9738

# Bind to a specific management network interface
sudo ./pcm-sensor-server -l 192.168.1.10

# Bind to all interfaces (default behavior)
sudo ./pcm-sensor-serverpcm-sensor-server now runs natively on Windows. Key points:
- Requirements: Windows 10+ or Windows Server 2016+ (earlier versions may work but are no longer officially supported), Administrator privileges, MSR driver installed
- Build instructions: See WINDOWS_HOWTO.md
- Limitations:
- Daemon mode (
-d) not available - runs in foreground only - Real-time priority (
-R) not available - Use Ctrl+C to stop the server
- Daemon mode (
Example on Windows:
# Run as Administrator
pcm-sensor-server.exe -p 9738
The default output of pcm-sensor-server endpoint in a browser:

pcm-sensor-server collects and serves internal CPU metric information on the system. Do not expose its HTTP/HTTPS endpoints to untrusted or publicly accessible networks. Prefer binding to localhost or a dedicated management interface (see -l|--listen above), and use firewalling and/or an authenticated reverse proxy if remote access is required. High request rates can overload the host and lead to a denial of service.
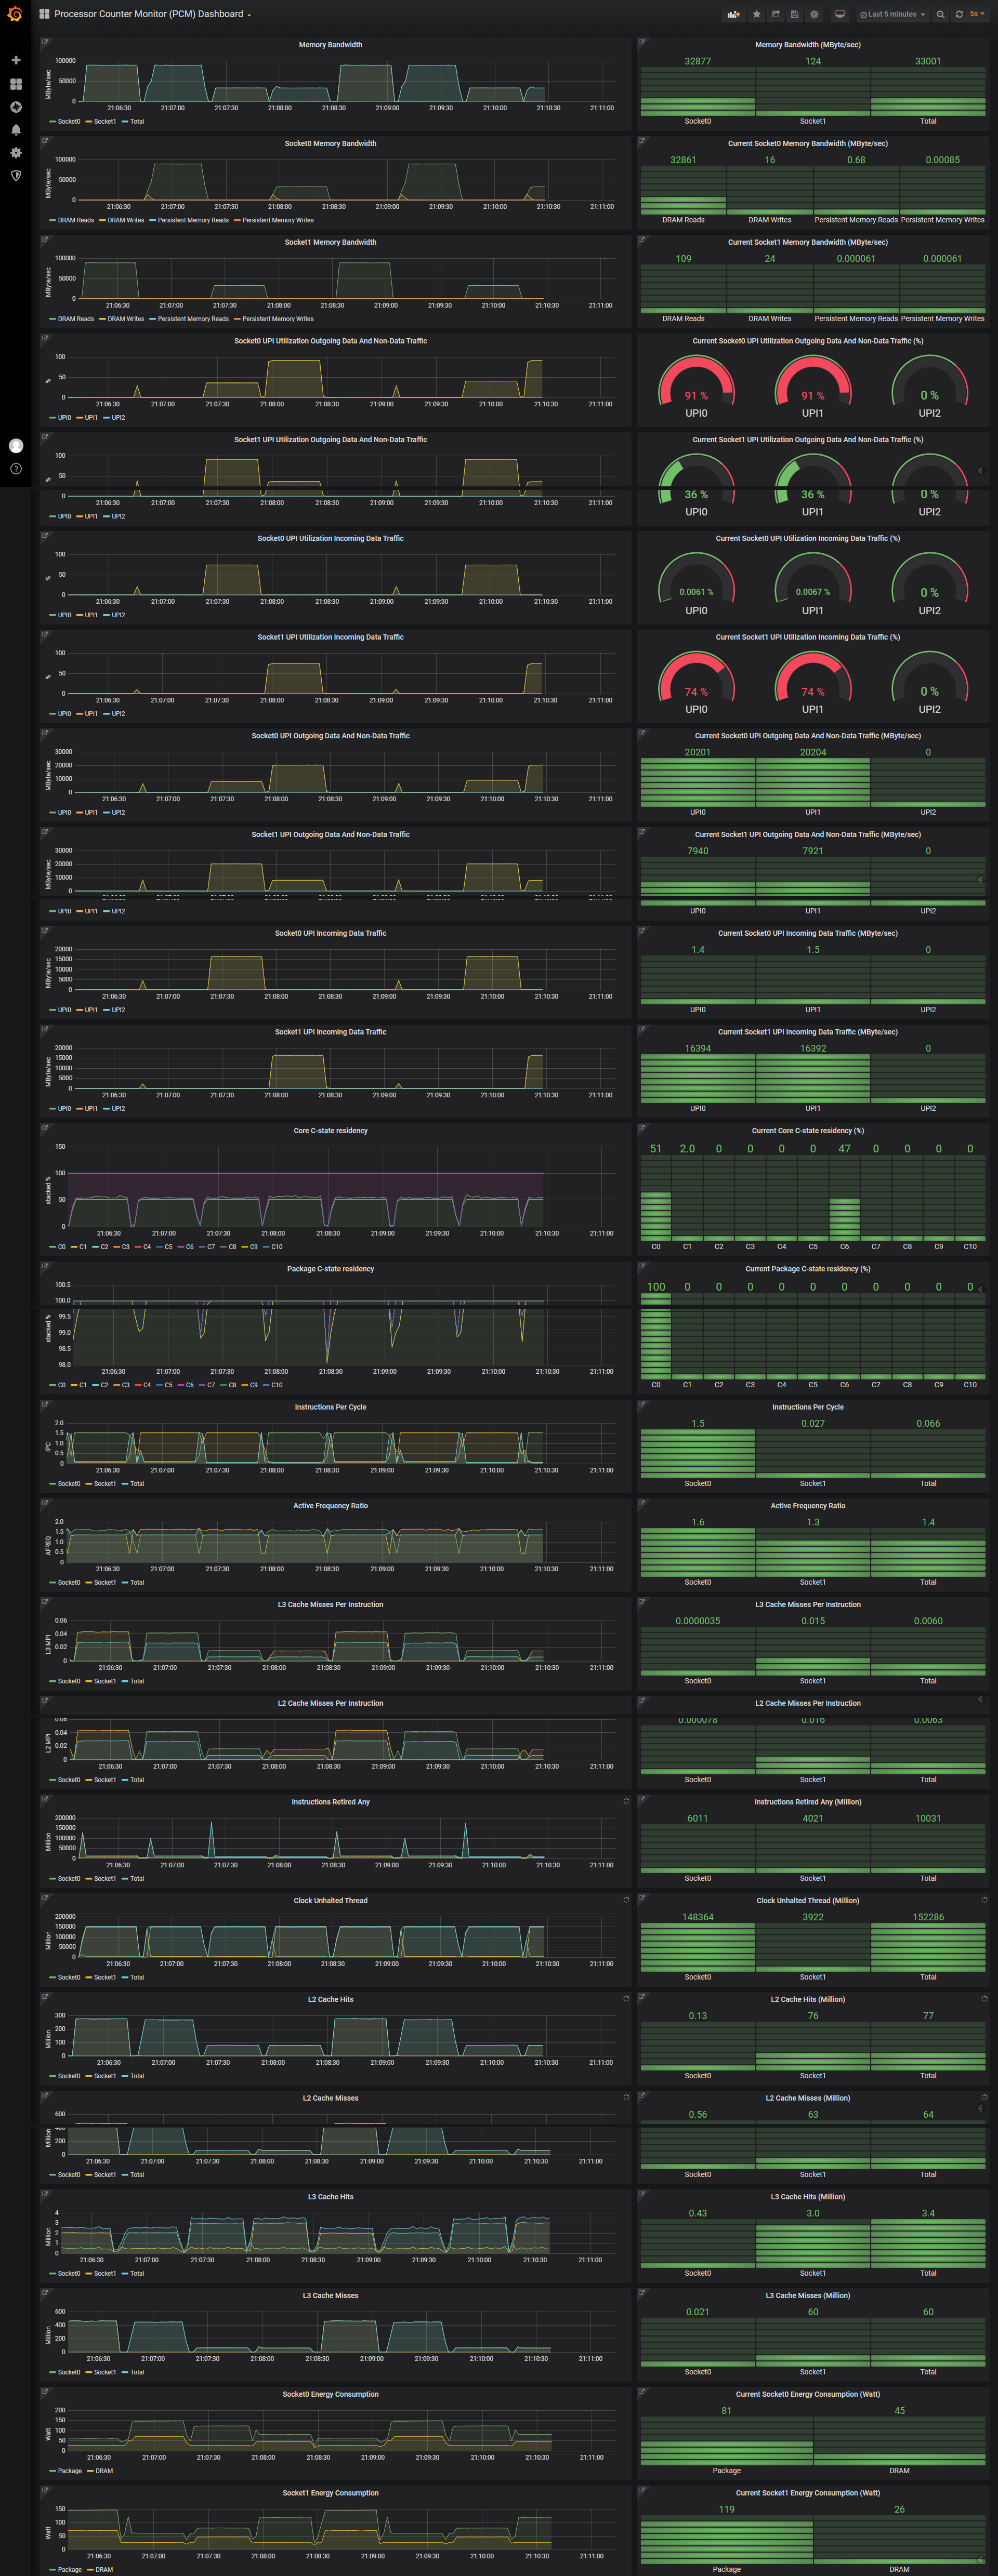
The PCM exporter can be used together with Grafana to obtain these Intel processor metrics (see how-to):
| Event Name | Description |
|---|---|
| Measurement_Interval_in_us | How many us elapsed to complete the last measurement |
| Number_of_sockets | Number of CPU sockets in the system |
OS_ID is the OS assigned ID of the logical CPU core and denotes the socket id, core id and thread id.
The events below are followed by the same {socket="socket id",core="core id",thread="thread id"} as the OS_ID of their section with source="socket/core/thread" appended that denotes what the quantity of the event accounts for.
For example Instructions_Retired_Any{socket="0",core="1",thread="1",source="core"} refers to Instructions_Retired_Any for socket 0, core 1, thread 1, and accounts for the total instructions retired of the specified core.
| Event | Description |
|---|---|
| Instructions_Retired_Any | Total number of Retired instructions |
| Clock_Unhalted_Thread | Counts the number of core cycles while the thread is not |
| in a halt state. | |
| Clock_Unhalted_Ref | Counts the number of reference cycles that the thread is |
| not in a halt state. The thread enters the halt state when | |
| it is running the HLT instruction. This event is not | |
| affected by thread frequency changes but counts as if the | |
| thread is running at the maximum frequency all the time. | |
| L3_Cache_Misses | Total number of L3 Cache misses |
| L3_Cache_Hits | Total number of L3 Cache hits |
| L2_Cache_Misses | Total number of L2 Cache misses |
| L2_Cache_Hits | Total number of L2 Cache hits |
| L3_Cache_Occupancy | Computes L3 Cache Occupancy |
| SMI_Count | SMI (System Management Interrupt) count |
| Invariant_TSC | Calculates the invariant TSC clocks (the invariant TSC |
| means that the TSC continues at a fixed rate regardless of | |
| the C-state or frequency of the processor as long as the | |
| processor remains in the ACPI S0 state. | |
| Thermal_Headroom | Celsius degrees before reaching TjMax temperature |
| CStateResidency | This is the percentage of time that the core (or the whole |
| package) spends in a particular level of C-state |
References:
https://software.intel.com/content/www/us/en/develop/articles/intel-performance-counter-monitor.html https://software.intel.com/content/dam/develop/external/us/en/documents-tps/325384-sdm-vol-3abcd.pdf - Chapter 18 Performance Monitoring