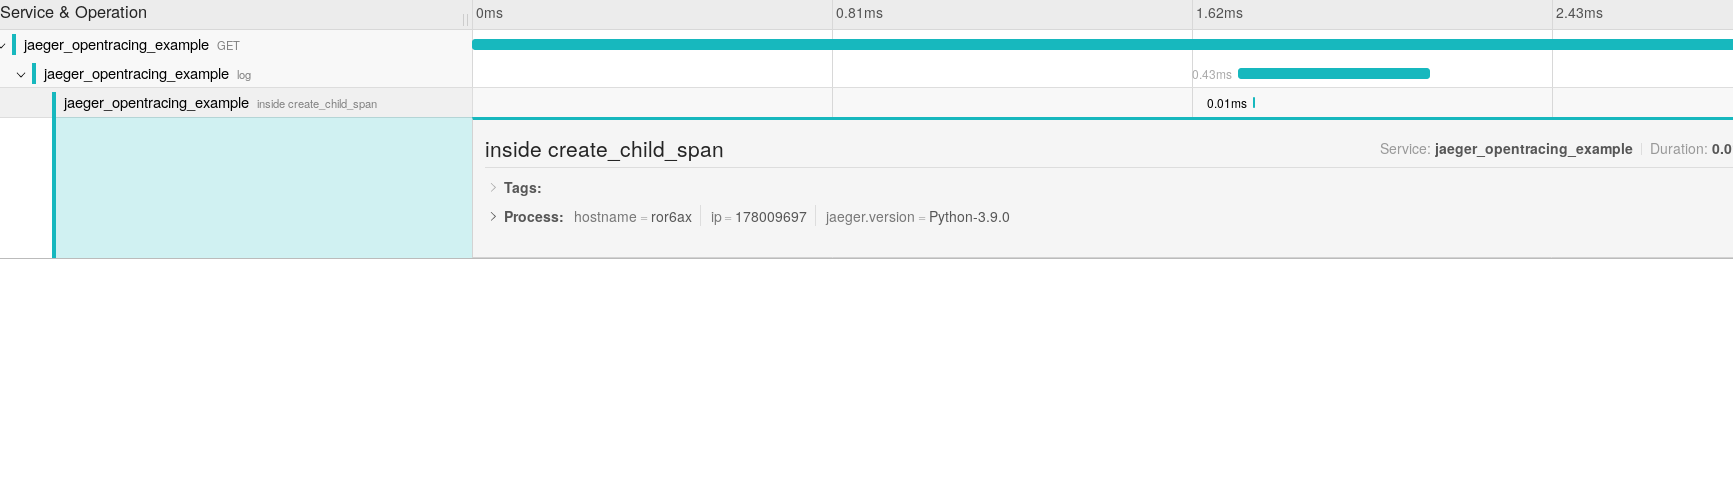
This example has a sanic client and server and shows how to trace the requests to a webserver from a client using the sanic_opentracing extension and a concrete variant of an OpenTracing tracer. To run, make sure that you run pip install for sanic, opentracing, jaeger_client.
First, we'll have to download and run our Jaeger instance. It collects and displays traces in neat graphical format.
If you already have Docker installed, run this:
docker run -d --name jaeger \
  -e COLLECTOR_ZIPKIN_HTTP_PORT=9411 \
  -p 5775:5775/udp \
  -p 6831:6831/udp \
  -p 6832:6832/udp \
  -p 5778:5778 \
  -p 16686:16686 \
  -p 14268:14268 \
  -p 9411:9411 \
  jaegertracing/all-in-one:latest
You should be able to see a web interface by browsing to http://localhost:16686/search
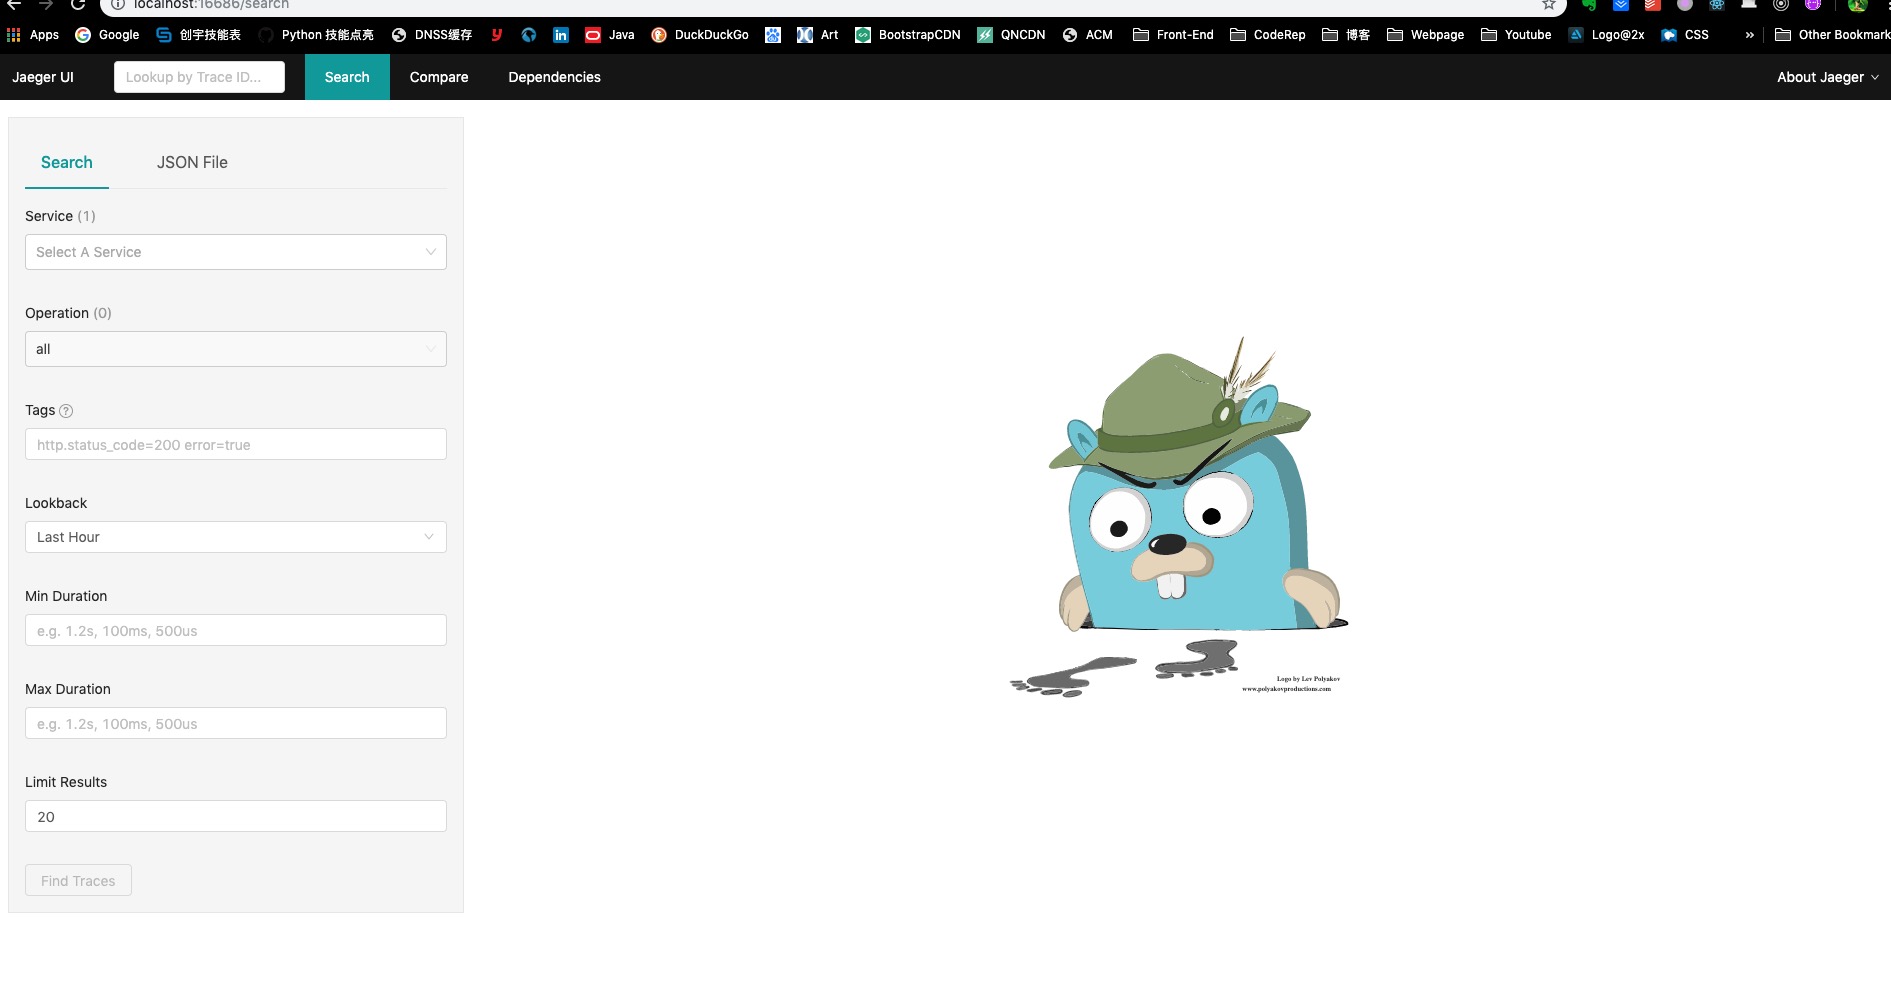
Now, open two terminals and navigate to this directory. Run the following commands in
- Start the server:
$ pip3 install -e requirements-example.py
$ python3 examples/server.py
- Run the client
$ python3 examples/client.py
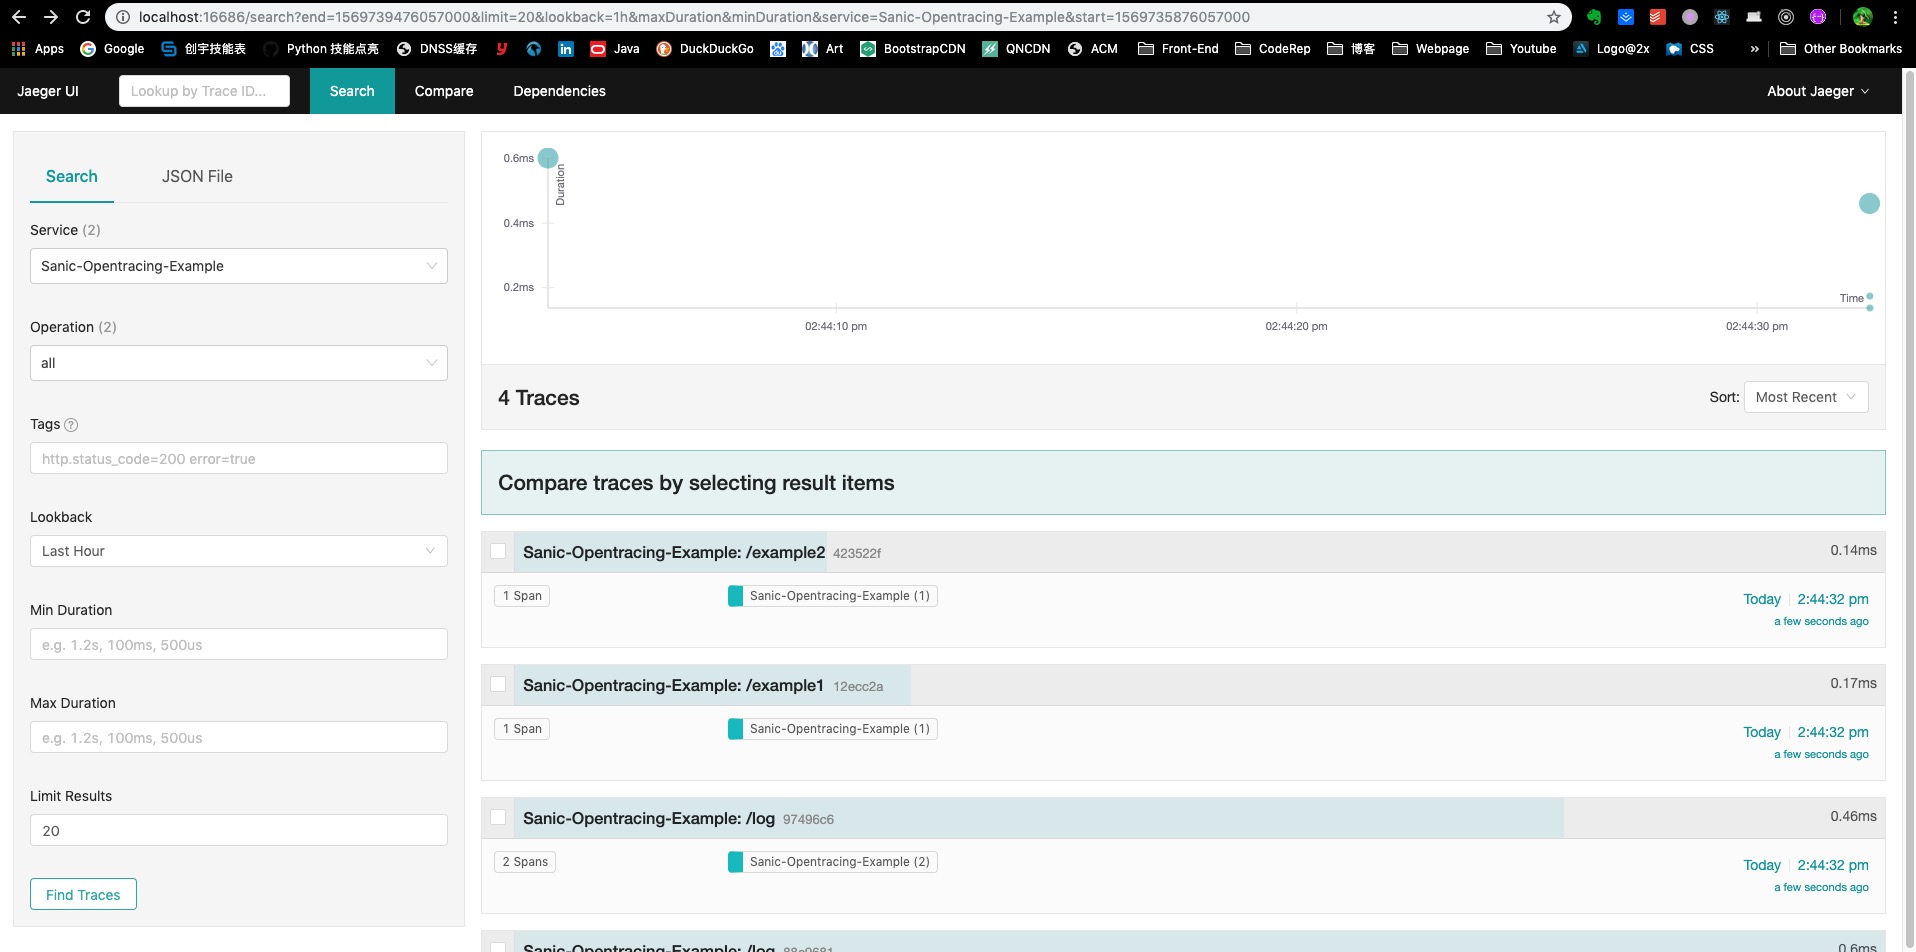
To see the traced requests, go to Jaeger web interface and refresh the page. Select your service name from dropdown on the left (it's "Sanic-Opentracing-Example" in this case) and press Find traces button at the bottom of the page.
(NOTE: if you wish to use a different OpenTracing tracer instead of Jaeger, simply replace
jaeger_tracer with the OpenTracing tracer instance of your choice.)
Browse to http://localhost:8000/log and compare the trace in Jaeger. The last one has 2 spans instead of 3. The span of webserver's GET method is missing. That is because client.py starts a trace and passes trace context over the wire, whereas the request from your browser has no tracing context in it.
In log function of the server app, we are creating current_span. This is done to trace the work that is being done to render the response to /log endpoint. Suppose there's a database connection happening. By creating a separate span for it, you'll be able to trace the DB request separately from rendering or the response. This gives a lot of flexibility to the user.
Speaking about databases, using install_all_patches() method from opentracing_instrumentation package gives you a way to trace your MySQLdb, SQLAlchemy, Redis queries without writing boilerplate code.
Following code shows how to create a span based on already existing one.
# child_scope.span automatically inherits from the Span created
# for this request by the Flask instrumentation.
child_scope = jaeger_tracer.start_active_span('inside create_child_span')
... do some stuff
child_scope.close()