The help text for the unbound_response_time_seconds histogram says: "Query response time in seconds"
I thought this meant it would measure the time unbound takes to respond to every client query, however it does not seem to include queries served from cache
The munin plugin plots total cache hits along with the histogram, putting them under the lowest histogram bucket
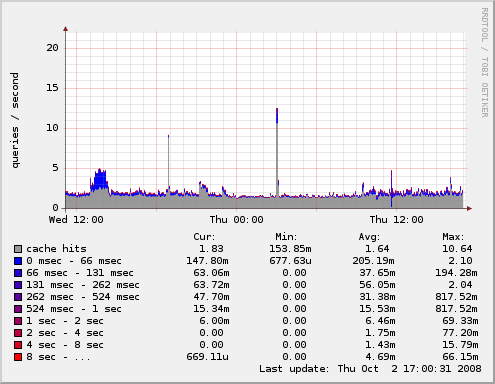
I'm not sure it's possible in Prometheus to do histogram quantile calculation over a histogram + another stray series interpreted as an extra bucket. Perhaps unbound_response_time_seconds should include cache hits in the lowest bucket? At least this should be documented
The help text for the unbound_response_time_seconds histogram says: "Query response time in seconds"
I thought this meant it would measure the time unbound takes to respond to every client query, however it does not seem to include queries served from cache
The munin plugin plots total cache hits along with the histogram, putting them under the lowest histogram bucket
I'm not sure it's possible in Prometheus to do histogram quantile calculation over a histogram + another stray series interpreted as an extra bucket. Perhaps unbound_response_time_seconds should include cache hits in the lowest bucket? At least this should be documented