This repo contains the original data and the codes that reproduce the figures and results in the following paper:
A. Boukouras, W. Jennings, L. Li, Z. Maniadis,"Can Biased Polls Distort Electoral Results? Evidence from the Lab." European Journal of Political Economy, forthcoming.
-
To make sense of the following explanations, you may want to have a quick look at the working paper here.
-
You can also find the oTree source code for the experiment here.
This folder contains all data from experiments E1, E2 and E3.
E1_dataandE2_datawere collected at the Unversity of Southampton and Newcastle Business School between May and November 2018;E3_datawas collected at the University of York in June 2019.
The codes folder consists of two parts:
descriptive: codes that produce the descriptive results, such as Figure 4, Figure 5 and results in the Welfare Effects and Individual Behaviour section. All codes arepython.regression: codes that produce the regression results in Appendix B.pythonis used to clean the data, andstatais for regressions.
-
running
E1.py,E2.py, andE3.pygives you all the results in Results section. However, more work needs to be done to reproduce the exact figures.-
For instance, running
E1.pycreates the following figure different from Figure 4 in the paper.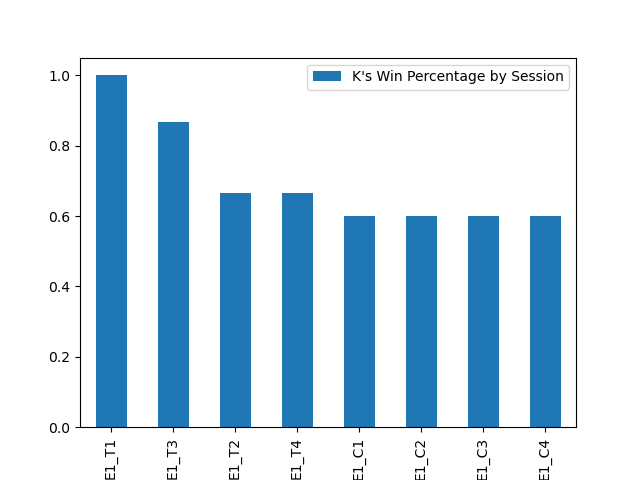
-
Also, after running
E1.py,E2.pyandE3.py, you will see the following.csvfiles in your working directory.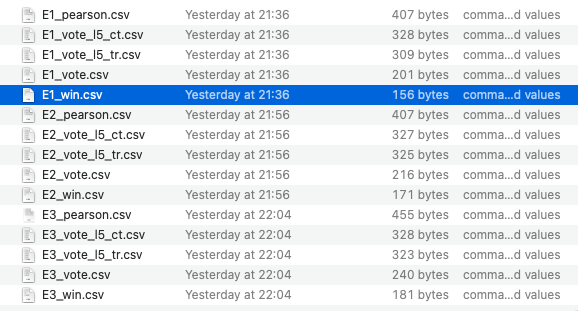
-
The
csvfiles store the numbers in the figures. For instance, the followingE1_win.csvis consistent with the bar graph above.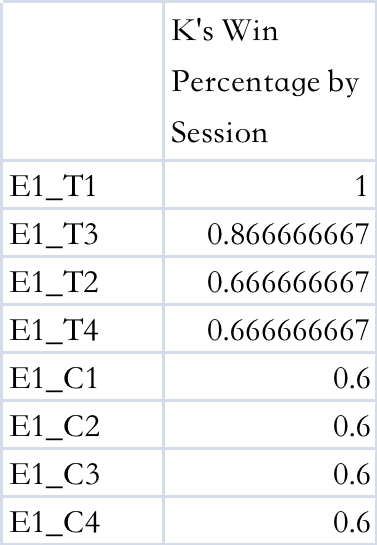
-
-
combine
E1_win.csv,E2_win.csvandE3_win.csv, so you have awin.xlsxfile looks like following: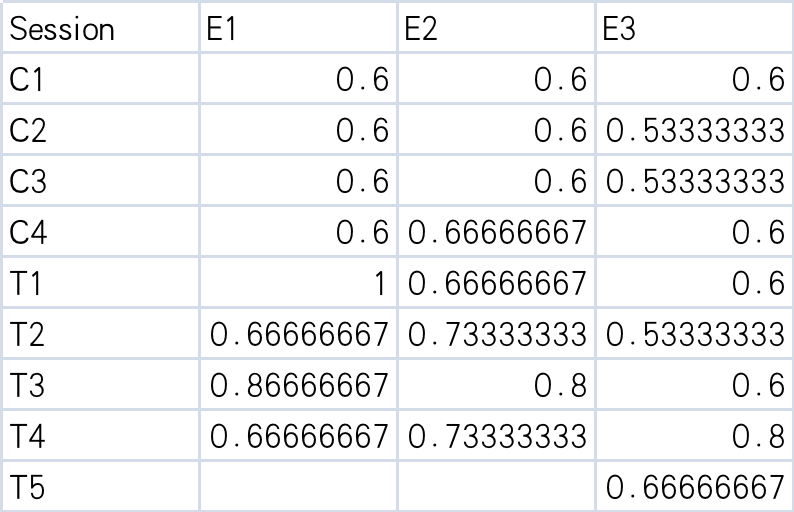
- combine all the
*_vote.csvfiles, and impelement the same process for all*_pearon.csvfiles, and you will have awin.xlsx, avote.xlsxand apearson.xlsxthat contain the results of all three experiments. - put all the these combined
csvfiles in the same directory withwin.py
- combine all the
-
run
win.py, and it gives you the figures in Figure 4. -
E1_additional_analysis.py,E2_additional_analysis.pyandE3_additional_analysis.pyproduce results in Welfare Effects and Individual Behaviour section and the tables in Appendix D.- Note that code does not output the tables directly, and some straightforward calculations and copy&paste work are still needed.
-
running
E1_reg.py,E2_reg.pyandE3_reg.pygives youAll_E1.csv,All_E2.csvandAll_E3.csv, and these are cleaned-up data for regressions.- Note that there is code for regressions at the end of the
pythonscripts. However, I wasn't familiar withstatsmodelspackage at the time, I switched tostatainstead.
- Note that there is code for regressions at the end of the
-
run
cluster.doto generate the results in Appendix B Additonal Econometric Analysis。- The
.dofile tests six models and only "model 1" and "model 3" in the script are presented in the online appendix of the final version.
- The
Notes: I apologise that the E1.py, E2.py and E3.py scripts are a bit messy. They are code drafts that also produce figures and results that, in the end, do not present in the final version of the paper. For the purpose of replicating the result of the final version, we commented out unnecessary code blocks. Should you have any questions, please email me at lunz3706@outlook.com.