Is your feature request related to a problem? Please describe.
I am working with registry based health data and stepwise survival curves are cosidered sensitive data, and I am therefor not allowed to publish such curves. Publishing a smooth plot would be the solution
Describe the solution you'd like
A clear and concise description of what you want to happen. I am aware, that in most cases you would prefer not to smooth the survival line, but there are some valid cases, where this approach is desirable.
Describe alternatives you've considered
The only solutions I have found was a StackOverflow with some suggested solutions, that wouldn't work.
Additional context
Below is a working example of the solution I have come up with to be able to plot the line and confidence intervals.
As an example, I have included the two standard methods used for smoothing in ggplot2::geom_smooth(), but I wanted to perform the calculations separately to have control over the method selection and to use the ggplot2::geom_ribbon() for confidence intervals.
library(tidyverse)
library(survival)
library(purrr)
library(ggsurvfit)

## Data
x <- survfit2(Surv(time, status) ~ surg, data = df_colon)
df <-
  tidy_survfit(x, type = "survival") %>% dplyr::mutate(survfit = c(list(x),
                                                                   rep_len(list(), dplyr::n() - 1L)))
method <- "gam"

df_split <- split(df,df$strata)

df_smoothed <- purrr::reduce(lapply(c("estimate","conf.low", "conf.high"), function(j) {
  do.call(rbind,
          lapply(seq_along(df_split), function(i) {
            nms <- names(df_split)[i]
            if (method=="loess"){
              y <-
                predict(loess(as.formula(paste0(
                  j[[1]], " ~ time"
                )), data = df_split[[i]]))
            } else if (method=="gam"){
              y <-
                predict(mgcv::gam(as.formula(paste0(
                  j[[1]], " ~ s(time, bs = 'cs')"
                )), data = df_split[[i]]))
            }
            df <- data.frame(df_split[[i]]$time, y, nms)
            names(df) <- c("time", paste0(j[[1]], ".smooth"), "strata")
            df
          }))
}),dplyr::full_join) |> full_join(df)
#> Joining with `by = join_by(time, strata)`
#> Joining with `by = join_by(time, strata)`
#> Joining with `by = join_by(time, strata)`

## Plotting
ggplot(data=df_smoothed) +
  geom_line(aes(x=time, y=estimate.smooth, color = strata))+
  geom_ribbon(aes(x=time, ymin = conf.low.smooth, ymax = conf.high.smooth, fill = strata), alpha = 0.50)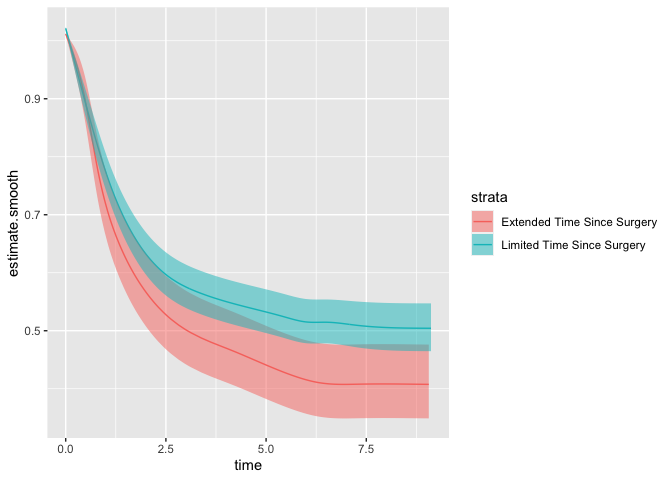
Created on 2023-09-15 with reprex v2.0.2
Is your feature request related to a problem? Please describe.
I am working with registry based health data and stepwise survival curves are cosidered sensitive data, and I am therefor not allowed to publish such curves. Publishing a smooth plot would be the solution
Describe the solution you'd like
A clear and concise description of what you want to happen. I am aware, that in most cases you would prefer not to smooth the survival line, but there are some valid cases, where this approach is desirable.
Describe alternatives you've considered
The only solutions I have found was a StackOverflow with some suggested solutions, that wouldn't work.
Additional context
Below is a working example of the solution I have come up with to be able to plot the line and confidence intervals.
As an example, I have included the two standard methods used for smoothing in
ggplot2::geom_smooth(), but I wanted to perform the calculations separately to have control over the method selection and to use theggplot2::geom_ribbon()for confidence intervals.Created on 2023-09-15 with reprex v2.0.2