There is something going on in the released version of the package when printing the plots. In the example below, the object is returned as class "add_risktable" instead of a plot object, and when printed, we just get a list of the object's internals. (In the middle of the print, is the primary plot object which does print, but without the risktable)
library(ggsurvfit)
#> Loading required package: ggplot2
packageVersion("ggsurvfit")
#> [1] '1.2.0'

p <-
  tidycmprsk::trial |>
  # dplyr::mutate(trt = factor(trt, levels = c("Drug B", "Drug A"))) |>
  tidycmprsk::cuminc(Surv(ttdeath, death_cr) ~ trt, data = _) |>
  ggcuminc() |>
  add_risktable()
#> Plotting outcome "death from cancer".

class(p)
#> [1] "add_risktable"
p
#> list()
#> attr(,"add_risktable")
#> attr(,"add_risktable")$times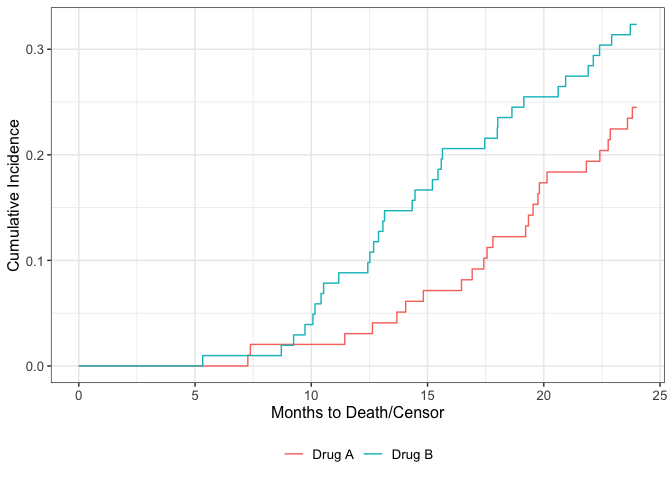
#>
#> attr(,"add_risktable")$risktable_stats
#> [1] "{n.risk}"    "{cum.event}"
#>
#> attr(,"add_risktable")$stats_label
#> NULL
#>
#> attr(,"add_risktable")$combine_groups
#> [1] FALSE
#>
#> attr(,"add_risktable")$risktable_group
#> [1] "auto"
#>
#> attr(,"add_risktable")$risktable_height
#> NULL
#>
#> attr(,"add_risktable")$theme
#> attr(,"add_risktable")$theme[[1]]
#> <theme> List of 144
#>  $ line                            : <ggplot2::element_line>
#>   ..@ colour       : chr "black"
#>   ..@ linewidth    : num 0.5
#>   ..@ linetype     : num 1
#>   ..@ lineend      : chr "butt"
#>   ..@ linejoin     : chr "round"
#>   ..@ arrow        : logi FALSE
#>   ..@ arrow.fill   : chr "black"
#>   ..@ inherit.blank: logi TRUE
#>  $ rect                            : <ggplot2::element_rect>
#>   ..@ fill         : chr "white"
#>   ..@ colour       : chr "black"
#>   ..@ linewidth    : num 0.5
#>   ..@ linetype     : num 1
#>   ..@ linejoin     : chr "round"
#>   ..@ inherit.blank: logi TRUE
#>  $ text                            : <ggplot2::element_text>
#>   ..@ family       : chr ""
#>   ..@ face         : chr "plain"
#>   ..@ italic       : chr NA
#>   ..@ fontweight   : num NA
#>   ..@ fontwidth    : num NA
#>   ..@ colour       : chr "black"
#>   ..@ size         : num 11
#>   ..@ hjust        : num 0.5
#>   ..@ vjust        : num 0.5
#>   ..@ angle        : num 0
#>   ..@ lineheight   : num 0.9
#>   ..@ margin       : <ggplot2::margin> num [1:4] 0 0 0 0
#>   ..@ debug        : logi FALSE
#>   ..@ inherit.blank: logi TRUE
#>  $ title                           : <ggplot2::element_text>
#>   ..@ family       : NULL
#>   ..@ face         : NULL
#>   ..@ italic       : chr NA
#>   ..@ fontweight   : num NA
#>   ..@ fontwidth    : num NA
#>   ..@ colour       : NULL
#>   ..@ size         : NULL
#>   ..@ hjust        : NULL
#>   ..@ vjust        : NULL
#>   ..@ angle        : NULL
#>   ..@ lineheight   : NULL
#>   ..@ margin       : NULL
#>   ..@ debug        : NULL
#>   ..@ inherit.blank: logi TRUE
#>  $ point                           : <ggplot2::element_point>
#>   ..@ colour       : chr "black"
#>   ..@ shape        : num 19
#>   ..@ size         : num 1.5
#>   ..@ fill         : chr "white"
#>   ..@ stroke       : num 0.5
#>   ..@ inherit.blank: logi TRUE
#>  $ polygon                         : <ggplot2::element_polygon>
#>   ..@ fill         : chr "white"
#>   ..@ colour       : chr "black"
#>   ..@ linewidth    : num 0.5
#>   ..@ linetype     : num 1
#>   ..@ linejoin     : chr "round"
#>   ..@ inherit.blank: logi TRUE
#>  $ geom                            : <ggplot2::element_geom>
#>   ..@ ink        : chr "black"
#>   ..@ paper      : chr "white"
#>   ..@ accent     : chr "#3366FF"
#>   ..@ linewidth  : num 0.5
#>   ..@ borderwidth: num 0.5
#>   ..@ linetype   : int 1
#>   ..@ bordertype : int 1
#>   ..@ family     : chr ""
#>   ..@ fontsize   : num 3.87
#>   ..@ pointsize  : num 1.5
#>   ..@ pointshape : num 19
#>   ..@ colour     : NULL
#>   ..@ fill       : NULL
#>  $ spacing                         : 'simpleUnit' num 5.5points
#>   ..- attr(*, "unit")= int 8
#>  $ margins                         : <ggplot2::margin> num [1:4] 5.5 5.5 5.5 5.5
#>  $ aspect.ratio                    : NULL
#>  $ axis.title                      : NULL
#>  $ axis.title.x                    : <ggplot2::element_text>
#>   ..@ family       : NULL
#>   ..@ face         : NULL
#>   ..@ italic       : chr NA
#>   ..@ fontweight   : num NA
#>   ..@ fontwidth    : num NA
#>   ..@ colour       : NULL
#>   ..@ size         : NULL
#>   ..@ hjust        : NULL
#>   ..@ vjust        : num 1
#>   ..@ angle        : NULL
#>   ..@ lineheight   : NULL
#>   ..@ margin       : <ggplot2::margin> num [1:4] 2.75 0 0 0
#>   ..@ debug        : NULL
#>   ..@ inherit.blank: logi TRUE
#>  $ axis.title.x.top                : <ggplot2::element_text>
#>   ..@ family       : NULL
#>   ..@ face         : NULL
#>   ..@ italic       : chr NA
#>   ..@ fontweight   : num NA
#>   ..@ fontwidth    : num NA
#>   ..@ colour       : NULL
#>   ..@ size         : NULL
#>   ..@ hjust        : NULL
#>   ..@ vjust        : num 0
#>   ..@ angle        : NULL
#>   ..@ lineheight   : NULL
#>   ..@ margin       : <ggplot2::margin> num [1:4] 0 0 2.75 0
#>   ..@ debug        : NULL
#>   ..@ inherit.blank: logi TRUE
#>  $ axis.title.x.bottom             : NULL
#>  $ axis.title.y                    : <ggplot2::element_text>
#>   ..@ family       : NULL
#>   ..@ face         : NULL
#>   ..@ italic       : chr NA
#>   ..@ fontweight   : num NA
#>   ..@ fontwidth    : num NA
#>   ..@ colour       : NULL
#>   ..@ size         : NULL
#>   ..@ hjust        : NULL
#>   ..@ vjust        : num 1
#>   ..@ angle        : num 90
#>   ..@ lineheight   : NULL
#>   ..@ margin       : <ggplot2::margin> num [1:4] 0 2.75 0 0
#>   ..@ debug        : NULL
#>   ..@ inherit.blank: logi TRUE
#>  $ axis.title.y.left               : NULL
#>  $ axis.title.y.right              : <ggplot2::element_text>
#>   ..@ family       : NULL
#>   ..@ face         : NULL
#>   ..@ italic       : chr NA
#>   ..@ fontweight   : num NA
#>   ..@ fontwidth    : num NA
#>   ..@ colour       : NULL
#>   ..@ size         : NULL
#>   ..@ hjust        : NULL
#>   ..@ vjust        : num 1
#>   ..@ angle        : num -90
#>   ..@ lineheight   : NULL
#>   ..@ margin       : <ggplot2::margin> num [1:4] 0 0 0 2.75
#>   ..@ debug        : NULL
#>   ..@ inherit.blank: logi TRUE
#>  $ axis.text                       : <ggplot2::element_text>
#>   ..@ family       : NULL
#>   ..@ face         : NULL
#>   ..@ italic       : chr NA
#>   ..@ fontweight   : num NA
#>   ..@ fontwidth    : num NA
#>   ..@ colour       : chr "#4D4D4DFF"
#>   ..@ size         : 'rel' num 0.8
#>   ..@ hjust        : NULL
#>   ..@ vjust        : NULL
#>   ..@ angle        : NULL
#>   ..@ lineheight   : NULL
#>   ..@ margin       : NULL
#>   ..@ debug        : NULL
#>   ..@ inherit.blank: logi TRUE
#>  $ axis.text.x                     : <ggplot2::element_text>
#>   ..@ family       : NULL
#>   ..@ face         : NULL
#>   ..@ italic       : chr NA
#>   ..@ fontweight   : num NA
#>   ..@ fontwidth    : num NA
#>   ..@ colour       : NULL
#>   ..@ size         : NULL
#>   ..@ hjust        : NULL
#>   ..@ vjust        : num 1
#>   ..@ angle        : NULL
#>   ..@ lineheight   : NULL
#>   ..@ margin       : <ggplot2::margin> num [1:4] 2.2 0 0 0
#>   ..@ debug        : NULL
#>   ..@ inherit.blank: logi TRUE
#>  $ axis.text.x.top                 : <ggplot2::element_text>
#>   ..@ family       : NULL
#>   ..@ face         : NULL
#>   ..@ italic       : chr NA
#>   ..@ fontweight   : num NA
#>   ..@ fontwidth    : num NA
#>   ..@ colour       : NULL
#>   ..@ size         : NULL
#>   ..@ hjust        : NULL
#>   ..@ vjust        : num 0
#>   ..@ angle        : NULL
#>   ..@ lineheight   : NULL
#>   ..@ margin       : <ggplot2::margin> num [1:4] 0 0 2.2 0
#>   ..@ debug        : NULL
#>   ..@ inherit.blank: logi TRUE
#>  $ axis.text.x.bottom              : NULL
#>  $ axis.text.y                     : <ggplot2::element_text>
#>   ..@ family       : NULL
#>   ..@ face         : NULL
#>   ..@ italic       : chr NA
#>   ..@ fontweight   : num NA
#>   ..@ fontwidth    : num NA
#>   ..@ colour       : NULL
#>   ..@ size         : NULL
#>   ..@ hjust        : num 1
#>   ..@ vjust        : NULL
#>   ..@ angle        : NULL
#>   ..@ lineheight   : NULL
#>   ..@ margin       : <ggplot2::margin> num [1:4] 0 2.2 0 0
#>   ..@ debug        : NULL
#>   ..@ inherit.blank: logi TRUE
#>  $ axis.text.y.left                : NULL
#>  $ axis.text.y.right               : <ggplot2::element_text>
#>   ..@ family       : NULL
#>   ..@ face         : NULL
#>   ..@ italic       : chr NA
#>   ..@ fontweight   : num NA
#>   ..@ fontwidth    : num NA
#>   ..@ colour       : NULL
#>   ..@ size         : NULL
#>   ..@ hjust        : num 0
#>   ..@ vjust        : NULL
#>   ..@ angle        : NULL
#>   ..@ lineheight   : NULL
#>   ..@ margin       : <ggplot2::margin> num [1:4] 0 0 0 2.2
#>   ..@ debug        : NULL
#>   ..@ inherit.blank: logi TRUE
#>  $ axis.text.theta                 : NULL
#>  $ axis.text.r                     : <ggplot2::element_text>
#>   ..@ family       : NULL
#>   ..@ face         : NULL
#>   ..@ italic       : chr NA
#>   ..@ fontweight   : num NA
#>   ..@ fontwidth    : num NA
#>   ..@ colour       : NULL
#>   ..@ size         : NULL
#>   ..@ hjust        : num 0.5
#>   ..@ vjust        : NULL
#>   ..@ angle        : NULL
#>   ..@ lineheight   : NULL
#>   ..@ margin       : <ggplot2::margin> num [1:4] 0 2.2 0 2.2
#>   ..@ debug        : NULL
#>   ..@ inherit.blank: logi TRUE
#>  $ axis.ticks                      : <ggplot2::element_line>
#>   ..@ colour       : chr "#333333FF"
#>   ..@ linewidth    : NULL
#>   ..@ linetype     : NULL
#>   ..@ lineend      : NULL
#>   ..@ linejoin     : NULL
#>   ..@ arrow        : logi FALSE
#>   ..@ arrow.fill   : chr "#333333FF"
#>   ..@ inherit.blank: logi TRUE
#>  $ axis.ticks.x                    : NULL
#>  $ axis.ticks.x.top                : NULL
#>  $ axis.ticks.x.bottom             : NULL
#>  $ axis.ticks.y                    : NULL
#>  $ axis.ticks.y.left               : NULL
#>  $ axis.ticks.y.right              : NULL
#>  $ axis.ticks.theta                : NULL
#>  $ axis.ticks.r                    : NULL
#>  $ axis.minor.ticks.x.top          : NULL
#>  $ axis.minor.ticks.x.bottom       : NULL
#>  $ axis.minor.ticks.y.left         : NULL
#>  $ axis.minor.ticks.y.right        : NULL
#>  $ axis.minor.ticks.theta          : NULL
#>  $ axis.minor.ticks.r              : NULL
#>  $ axis.ticks.length               : 'rel' num 0.5
#>  $ axis.ticks.length.x             : NULL
#>  $ axis.ticks.length.x.top         : NULL
#>  $ axis.ticks.length.x.bottom      : NULL
#>  $ axis.ticks.length.y             : NULL
#>  $ axis.ticks.length.y.left        : NULL
#>  $ axis.ticks.length.y.right       : NULL
#>  $ axis.ticks.length.theta         : NULL
#>  $ axis.ticks.length.r             : NULL
#>  $ axis.minor.ticks.length         : 'rel' num 0.75
#>  $ axis.minor.ticks.length.x       : NULL
#>  $ axis.minor.ticks.length.x.top   : NULL
#>  $ axis.minor.ticks.length.x.bottom: NULL
#>  $ axis.minor.ticks.length.y       : NULL
#>  $ axis.minor.ticks.length.y.left  : NULL
#>  $ axis.minor.ticks.length.y.right : NULL
#>  $ axis.minor.ticks.length.theta   : NULL
#>  $ axis.minor.ticks.length.r       : NULL
#>  $ axis.line                       : <ggplot2::element_blank>
#>  $ axis.line.x                     : NULL
#>  $ axis.line.x.top                 : NULL
#>  $ axis.line.x.bottom              : NULL
#>  $ axis.line.y                     : NULL
#>  $ axis.line.y.left                : NULL
#>  $ axis.line.y.right               : NULL
#>  $ axis.line.theta                 : NULL
#>  $ axis.line.r                     : NULL
#>  $ legend.background               : <ggplot2::element_rect>
#>   ..@ fill         : NULL
#>   ..@ colour       : logi NA
#>   ..@ linewidth    : NULL
#>   ..@ linetype     : NULL
#>   ..@ linejoin     : NULL
#>   ..@ inherit.blank: logi TRUE
#>  $ legend.margin                   : NULL
#>  $ legend.spacing                  : 'rel' num 2
#>  $ legend.spacing.x                : NULL
#>  $ legend.spacing.y                : NULL
#>  $ legend.key                      : NULL
#>  $ legend.key.size                 : 'simpleUnit' num 1.2lines
#>   ..- attr(*, "unit")= int 3
#>  $ legend.key.height               : NULL
#>  $ legend.key.width                : NULL
#>  $ legend.key.spacing              : NULL
#>  $ legend.key.spacing.x            : NULL
#>  $ legend.key.spacing.y            : NULL
#>  $ legend.key.justification        : NULL
#>  $ legend.frame                    : NULL
#>  $ legend.ticks                    : NULL
#>  $ legend.ticks.length             : 'rel' num 0.2
#>  $ legend.axis.line                : NULL
#>  $ legend.text                     : <ggplot2::element_text>
#>   ..@ family       : NULL
#>   ..@ face         : NULL
#>   ..@ italic       : chr NA
#>   ..@ fontweight   : num NA
#>   ..@ fontwidth    : num NA
#>   ..@ colour       : NULL
#>   ..@ size         : 'rel' num 0.8
#>   ..@ hjust        : NULL
#>   ..@ vjust        : NULL
#>   ..@ angle        : NULL
#>   ..@ lineheight   : NULL
#>   ..@ margin       : NULL
#>   ..@ debug        : NULL
#>   ..@ inherit.blank: logi TRUE
#>  $ legend.text.position            : NULL
#>  $ legend.title                    : <ggplot2::element_text>
#>   ..@ family       : NULL
#>   ..@ face         : NULL
#>   ..@ italic       : chr NA
#>   ..@ fontweight   : num NA
#>   ..@ fontwidth    : num NA
#>   ..@ colour       : NULL
#>   ..@ size         : NULL
#>   ..@ hjust        : num 0
#>   ..@ vjust        : NULL
#>   ..@ angle        : NULL
#>   ..@ lineheight   : NULL
#>   ..@ margin       : NULL
#>   ..@ debug        : NULL
#>   ..@ inherit.blank: logi TRUE
#>  $ legend.title.position           : NULL
#>  $ legend.position                 : chr "right"
#>  $ legend.position.inside          : NULL
#>  $ legend.direction                : NULL
#>  $ legend.byrow                    : NULL
#>  $ legend.justification            : chr "center"
#>  $ legend.justification.top        : NULL
#>  $ legend.justification.bottom     : NULL
#>  $ legend.justification.left       : NULL
#>  $ legend.justification.right      : NULL
#>  $ legend.justification.inside     : NULL
#>   [list output truncated]
#>  @ complete: logi TRUE
#>  @ validate: logi TRUE
#>
#> attr(,"add_risktable")$theme[[2]]
#> <theme> List of 11
#>  $ axis.title.x    : <ggplot2::element_text>
#>   ..@ family       : NULL
#>   ..@ face         : NULL
#>   ..@ italic       : chr NA
#>   ..@ fontweight   : num NA
#>   ..@ fontwidth    : num NA
#>   ..@ colour       : NULL
#>   ..@ size         : num 9
#>   ..@ hjust        : num 1
#>   ..@ vjust        : num 1
#>   ..@ angle        : NULL
#>   ..@ lineheight   : NULL
#>   ..@ margin       : NULL
#>   ..@ debug        : NULL
#>   ..@ inherit.blank: logi FALSE
#>  $ axis.text.x     : <ggplot2::element_blank>
#>  $ axis.text.y     : <ggplot2::element_text>
#>   ..@ family       : NULL
#>   ..@ face         : chr "plain"
#>   ..@ italic       : chr NA
#>   ..@ fontweight   : num NA
#>   ..@ fontwidth    : num NA
#>   ..@ colour       : chr "black"
#>   ..@ size         : num 10
#>   ..@ hjust        : NULL
#>   ..@ vjust        : NULL
#>   ..@ angle        : NULL
#>   ..@ lineheight   : NULL
#>   ..@ margin       : NULL
#>   ..@ debug        : NULL
#>   ..@ inherit.blank: logi FALSE
#>  $ axis.ticks      : <ggplot2::element_blank>
#>  $ axis.line       : <ggplot2::element_blank>
#>  $ legend.position : chr "none"
#>  $ panel.border    : <ggplot2::element_blank>
#>  $ panel.grid.major: <ggplot2::element_blank>
#>  $ panel.grid.minor: <ggplot2::element_blank>
#>  $ plot.title      : <ggplot2::element_text>
#>   ..@ family       : NULL
#>   ..@ face         : NULL
#>   ..@ italic       : chr NA
#>   ..@ fontweight   : num NA
#>   ..@ fontwidth    : num NA
#>   ..@ colour       : NULL
#>   ..@ size         : num 10.8
#>   ..@ hjust        : num 0
#>   ..@ vjust        : num 0
#>   ..@ angle        : NULL
#>   ..@ lineheight   : NULL
#>   ..@ margin       : NULL
#>   ..@ debug        : NULL
#>   ..@ inherit.blank: logi FALSE
#>  $ plot.margin     : 'simpleUnit' num [1:4] 0points 5.5points 0points 5.5points
#>   ..- attr(*, "unit")= int 8
#>  @ complete: logi FALSE
#>  @ validate: logi TRUE
#>
#> attr(,"add_risktable")$theme[[3]]
#> <ggplot2::labels> List of 1
#>  $ x: NULL
#>
#> attr(,"add_risktable")$theme[[4]]
#> <ggplot2::labels> List of 1
#>  $ y: NULL
#>
#>
#> attr(,"add_risktable")$size
#> [1] 3.5
#>
#> attr(,"class")
#> [1] "add_risktable"
Created on 2025-10-03 with reprex v2.1.1
There is something going on in the released version of the package when printing the plots. In the example below, the object is returned as class "add_risktable" instead of a plot object, and when printed, we just get a list of the object's internals. (In the middle of the print, is the primary plot object which does print, but without the risktable)
Created on 2025-10-03 with reprex v2.1.1