Problem
There is an inconsistency in how the median survival time is calculated between cardx::ard_survival_survfit() and gtsummary::tbl_survfit() compared to the median from survival::quantile.survfit() when there is a plateau in survival at the specified quantile.
Cause
The issue is occurring because cardx::ard_survival_survfit() and gtsummary::tbl_survfit() both rely on survival::quantile.survfit() to estimate the median, while ggsurvfit::add_quantile() uses its own internal logic based on the values plotted to add the reference line to the plot.
According to the documentation for survival::quantile.survfit():
The kth quantile for a survival curve S(t) is the location at which a horizontal line at height p= 1-k intersects the plot of S(t). Since S(t) is a step function, it is possible for the curve to have a horizontal segment at exactly 1-k, in which case the midpoint of the horizontal segment is returned. This mirrors the standard behavior of the median when data is uncensored...
When a horizontal segment of the survival curve exactly matches one of the requested quantiles the returned value will be the midpoint of the horizontal segment; this agrees with the usual definition of a median for uncensored data...
Because of the discrepancy, users who want to use add_quantile() when there is a plateau at the specified value will get a discrepancy between values generated via other common functions despite using feeding in the exact same survfit object.
Reproducible Example
In the example below, I show the discrepancy between the quantile value plotted for the median from add_quantile() compared to the median reported via cardx::ard_survival_survfit() and gtsummary::tbl_survfit() (which both use survival::quantile.survfit()).
I also show an example plot with a reference line when pulling the median from quantile.survfit() (what most users would probably expect given the behavior of the other functions.
# Load all required libraries
library(survival)
library(ggsurvfit)
#> Loading required package: ggplot2
library(ggplot2)
library(dplyr)
#>
#> Attaching package: 'dplyr'
#> The following objects are masked from 'package:stats':
#>
#> filter, lag
#> The following objects are masked from 'package:base':
#>
#> intersect, setdiff, setequal, union
# --- Create a dataset with a plateau at S(t) = 0.5 ---
df_reprex <- data.frame(
time = c(1, 2, 3, 4, 5, 10, 12, 12, 12, 12),
status = c(1, 1, 1, 1, 1, 1, 0, 0, 0, 0)
)
# --- Create the survfit object ---
fit_reprex <- survfit(Surv(time, status) ~ 1, data = df_reprex)
# --- Get the `quantile.survfit()` result ---
median_interpolated <- quantile(fit_reprex, probs = 0.5)$quantile %>%
tibble::enframe(value = "median_time")
print(paste("Median from quantile.survfit()", median_interpolated$median_time))
#> [1] "Median from quantile.survfit() 7.5"
# --- Plot with ggsurvfit::add_quantile() ---
plot_add_quantile <- ggsurvfit(fit_reprex) +
add_quantile() +
scale_ggsurvfit() +
labs(
title = "add_quantile() uses earliest time at 0.5",
subtitle = "Note: Median line is at t = 5"
)
# --- Manually plot the `quantile.survfit()` result ---
# This plots the median generated from quantile.survfit()
plot_quantile_survfit <- ggsurvfit(fit_reprex) +
scale_ggsurvfit() +
# Manually add segments using the median from `quantile.survfit()`
geom_segment(
data = median_interpolated,
aes(x = 0, xend = median_time, y = 0.5, yend = 0.5),
linetype = 2, color = "red"
) +
geom_segment(
data = median_interpolated,
aes(x = median_time, xend = median_time, y = 0.5, yend = 0),
linetype = 2, color = "red"
) +
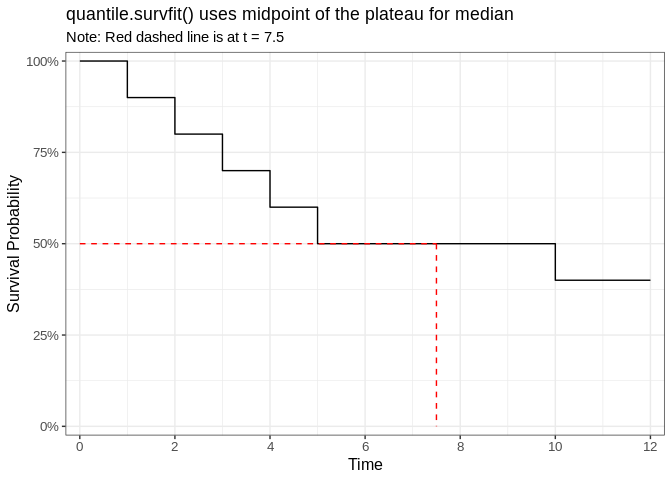
labs(
title = "quantile.survfit() uses midpoint of the plateau for median",
subtitle = paste0("Note: Red dashed line is at t = ", median_interpolated$median_time)
)
# --- Show the conflicting results ---
plot_add_quantile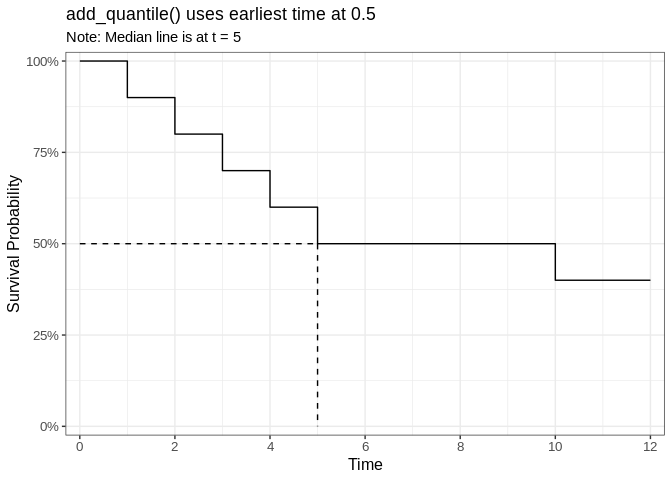
# --- Value from gtsummary::tbl_survfit() / cardx::ard_survival_survfit()
cardx::ard_survival_survfit(fit_reprex, probs = 0.5) %>%
  filter(stat_name == "estimate")
#> {cards} data frame: 1 x 9
#>   variable variable_level   context stat_name stat_label stat
#> 1     prob            0.5 survival…  estimate  Survival…  7.5
#> ℹ 3 more variables: fmt_fun, warning, error


gtsummary::tbl_survfit(fit_reprex, probs = 0.5) %>%
  gtsummary::as_kable()
#> Warning in attr(x, "align"): 'xfun::attr()' is deprecated.
#> Use 'xfun::attr2()' instead.
#> See help("Deprecated")
#> Warning in attr(x, "format"): 'xfun::attr()' is deprecated.
#> Use 'xfun::attr2()' instead.
#> See help("Deprecated")
| Characteristic |
50% Percentile |
| Overall |
7.5 (3.0, —) |
# Median survival calculated from cardx::ard_survival_survfit() - and by extension, gtsummary::tbl_survfit()
#    conflicts with the value used by ggsurvplot::add_quantile()
Created on 2025-11-10 with reprex v2.1.1
Problem
There is an inconsistency in how the median survival time is calculated between
cardx::ard_survival_survfit()andgtsummary::tbl_survfit()compared to the median fromsurvival::quantile.survfit()when there is a plateau in survival at the specified quantile.Cause
The issue is occurring because
cardx::ard_survival_survfit()andgtsummary::tbl_survfit()both rely onsurvival::quantile.survfit()to estimate the median, whileggsurvfit::add_quantile()uses its own internal logic based on the values plotted to add the reference line to the plot.According to the documentation for
survival::quantile.survfit():Because of the discrepancy, users who want to use
add_quantile()when there is a plateau at the specified value will get a discrepancy between values generated via other common functions despite using feeding in the exact samesurvfitobject.Reproducible Example
In the example below, I show the discrepancy between the quantile value plotted for the median from
add_quantile()compared to the median reported viacardx::ard_survival_survfit()andgtsummary::tbl_survfit()(which both usesurvival::quantile.survfit()).I also show an example plot with a reference line when pulling the median from
quantile.survfit()(what most users would probably expect given the behavior of the other functions.plot_quantile_survfitCreated on 2025-11-10 with reprex v2.1.1