[EPIC] Metric anomaly pattern matching #1136
Description
Issues:
- build example 1D CNN model for time-series pattern classification #1137
- create data simulator that simulates data for kicking off metric pattern classification model #1138
- A general normalization method to normalize any metrics data (includes simulated data and cortex data) into the format that metric pattern classification model needs #1139
- Python client code that pulls data from cortex. #1141
- implement the naive anomaly detection algorithm and experiments with data from cortex #1143
- write back-end APIs using fastAPI to connect different pieces together. #1169
- Dynamically generate Grafana dashboard by code #1142
- display generated dynamic grafana dashboard in Opni's grafana. resolves authentications. #1145
- Fault Injection tool/story for Metric Anomaly pattern matching. #1220
- Metric anomaly pattern analysis service - Frontend #1247
- Create gateway plugin to provide APIs to frontend #1249
- Docstring and basic test and Catch exceptions for APIs #1281
- Add options to run metric-ai service job run at cluster/namespace level metrics. #1349
Summary:
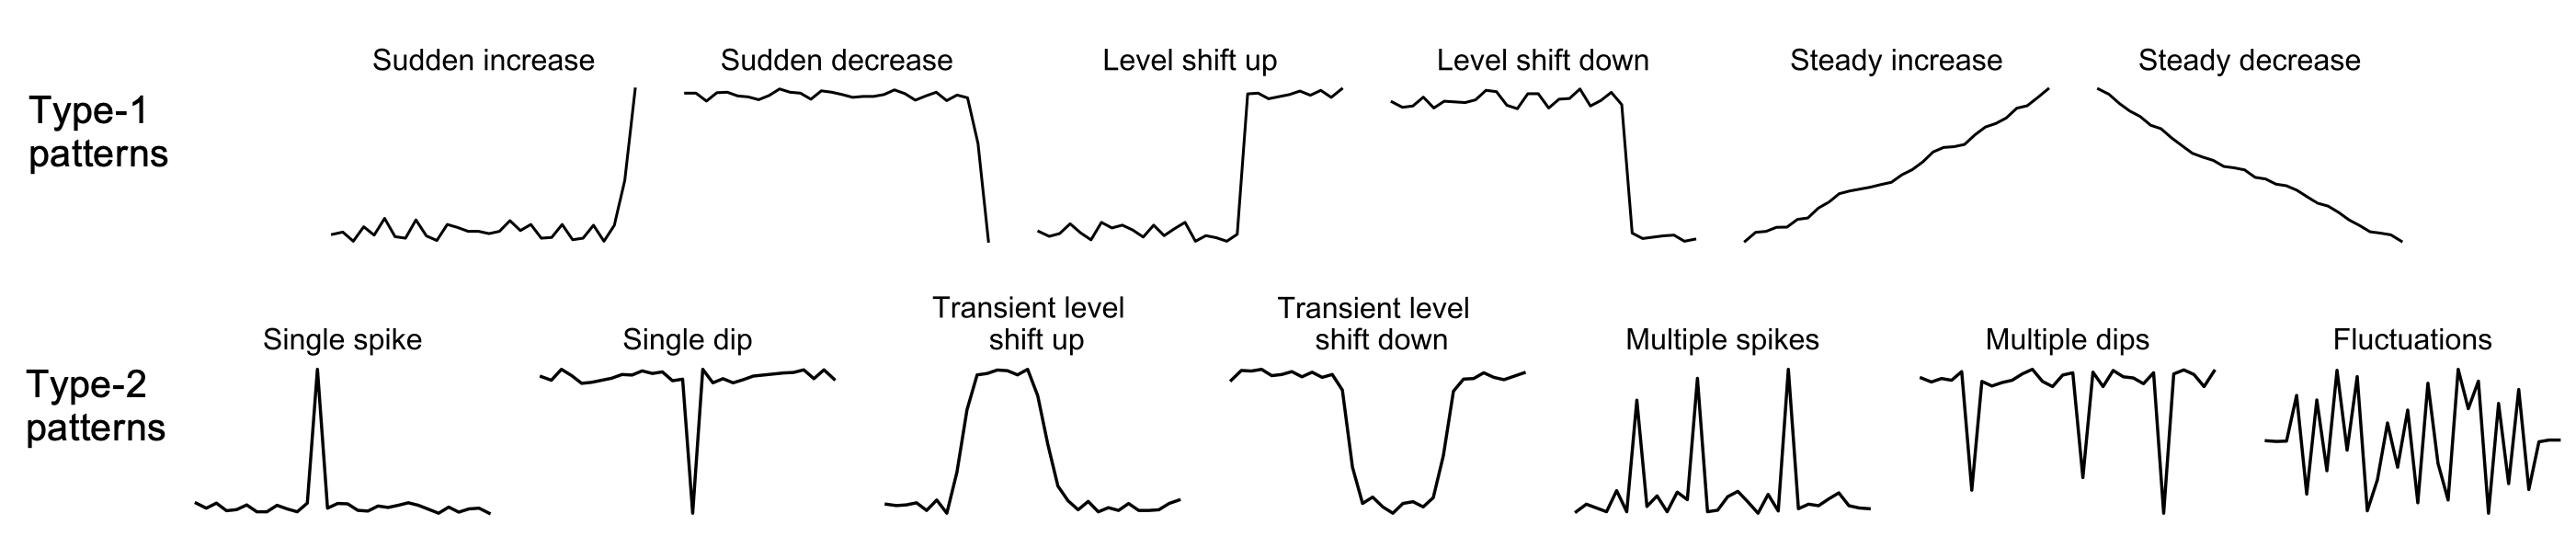
This enhancement proposal offers a new feature to match metrics to 2 types of known pre-defined anomaly chart patterns. For each time of the patterns, a grafana dashboard that visualize all anomaly metrics that match to the patterns will be dynamically generated for user to consume. This feature will make operators' life easier in the process of outage diagnosis.
The 2 types of pre-defined patterns:
Use case:
- Keeping track of all metrics in a multi-cluster setup is challenging. Subject matter experts could be responsible for hundreds of clusters and each cluster has tons of different metrics. Often times, SMEs are required to identify metrics that are important to a workload. Because only certain metrics are selected, there can be blind spots - as other metrics may capture details of the system overlooked by the metrics curated by SMEs. When an outage occurs, it's difficult to identify root-cause metrics to assist outage diagnosis. Users need tools to help them reduce the scope and identify anomaly metrics faster.
Implementation details:

-
UI -- Admin dashboard
- Metric insights page: Add a button in the UI for user to manually invoke this feature.
- Alert overview page: Attach a button to alerts for user to manually invoke this feature.
- the UX: a table that displays all downstream clusters so user can easily select 1 or more of them to generate metric-analysis report.
-
UI -- Dynamic Grafana dashboard: For each request of metric-analysis, generate 2 grafana dashboards for detected anomaly metrics with classified pattern types, 1 dashboard for metrics of Type-I patterns and another dashboard for metrics of Type-II patterns.
-
Metric-analysis service
- HTTP server: serves backend APIs using FastAPI. APIs:
- POST /request: post a request to invoke this feature, returns a random ID that can be used later. Spawns a background process to run the metric-analysis process.
- GET /get_all_requests_id: get all the history requests posted, return all the ids.
- GET /get_analysis_report_by_id: get an analysis report of given
id. - GET /get_all_analysis_report: get all history reports
- DELETE /delete_report_by_id: delete a report by id
- DELETE /delete_all_reports: delete all history reports
- Anomaly Detection: Apply
KS-testas the base metric anomaly detection method, this step will filter out normal metrics and only pass forward anomalous metric to the pattern classification model.- Input: a list of metrics, each metric with last 1 hour(in terms of the last 1 hour of time
tthat request is submitted) worth of value split by 1 minute time interval, which means there are 60 data points. - What to do: split the 60 data points [t-60, t-59, ...t-1] into 2 groups, the normal window, aka the first 45 points [t-60, t-16], and the test window [t-15, t-1], use KS-test to compare them. If the p-value of the test
p < 0.05then this metric is abnormal and will be pass forward to next step. - Output: the same list of metrics as input, but with a label of either
NormalorAbnormalwith the corresponding p-value.
- Input: a list of metrics, each metric with last 1 hour(in terms of the last 1 hour of time
- Metric Pattarn Classification:
- Model pre-train: A pre-trained model will be prepared offline and uploaded to Opni's S3 bucket. It can then be downloaded to every central Opni cluster to serve. Initially, the training data will be simulated plus data argumentation. With more real world data available in the future, the model can be further improved.
- Model inferencing: the pre-trained model will be downloaded from S3 and serve for inferencing. No GPU is needed for inferencing.
- Model details: 1D-CNN deep learning model, 1D means its input is 1D time-series data. This model will consist of 3 conv1d layers with max pooling, 2 fully-connected layers and softmax layer at last.
- Model input: A list of abnormal metrics from anomaly detection step, each metric with 60 data points.
- What to do: Apply MinMaxScaler to normalize input data points, then run inferencing on each normalized metric data to classify it into one of the pre-defined patterns.
- Model output: A list of abnormal metrics with their classified patterns.
- HTTP server: serves backend APIs using FastAPI. APIs:
-
The insights report: A summary of the metric-analysis results, saved to Nats KV storage. The metadata to include in the report:
- ID: assigned in the /request API.
- cluster ID/name: the downstream cluster this analysis was applied on.
- request time: the time this request was submitted.
- Analysis results:
- A list of abnormal metrics of Type-I patterns: a list of metrics that are identified as anomalous and with Type-I patterns, which indicates these metrics should be investigated first.
- A list of abnormal metrics of Type-II patterns: a list of metrics that are identified as anomalous and with Type-II patterns, which indicates these metrics were at abnormal state but recovered back to a relative normal state. These metrics still worth investigating if SMEs have the bandwith.
-
Cortex, collect metric data. Send a request to Cortex to pull related metric data.
Acceptance criteria:
-
UI, Admin Dashboard, metric insights page.
- Buttons to trigger this new feature work as expected.
- A table to display all submitted request and their corresponding report. Click on each item to show the report. Attach a link to the generated grafana dashboards.
-
Metric-analysis service:
- all the backend APIs should work as expected.
- pattern classification model has an accuracy above 98%. Pre-trained model downloaded from S3 and serve correctly,
-
Analyse report generated correctly, with all the required metadata fields and information, save successfully to Nats KV storage.