-
Notifications
You must be signed in to change notification settings - Fork 1
Expand file tree
/
Copy pathREADME.Rmd
More file actions
180 lines (125 loc) · 9.26 KB
/
Copy pathREADME.Rmd
File metadata and controls
180 lines (125 loc) · 9.26 KB
1
2
3
4
5
6
7
8
9
10
11
12
13
14
15
16
17
18
19
20
21
22
23
24
25
26
27
28
29
30
31
32
33
34
35
36
37
38
39
40
41
42
43
44
45
46
47
48
49
50
51
52
53
54
55
56
57
58
59
60
61
62
63
64
65
66
67
68
69
70
71
72
73
74
75
76
77
78
79
80
81
82
83
84
85
86
87
88
89
90
91
92
93
94
95
96
97
98
99
100
101
102
103
104
105
106
107
108
109
110
111
112
113
114
115
116
117
118
119
120
121
122
123
124
125
126
127
128
129
130
131
132
133
134
135
136
137
138
139
140
141
142
143
144
145
146
147
148
149
150
151
152
153
154
155
156
157
158
159
160
161
162
163
164
165
166
167
168
169
170
171
172
173
174
175
176
177
178
179
180
---
output: github_document
---
<!-- README.md is generated from README.Rmd. Please edit that file -->
```{r, include = FALSE}
knitr::opts_chunk$set(
collapse = TRUE,
comment = "#>",
fig.path = "man/figures",
out.width = "100%"
)
```
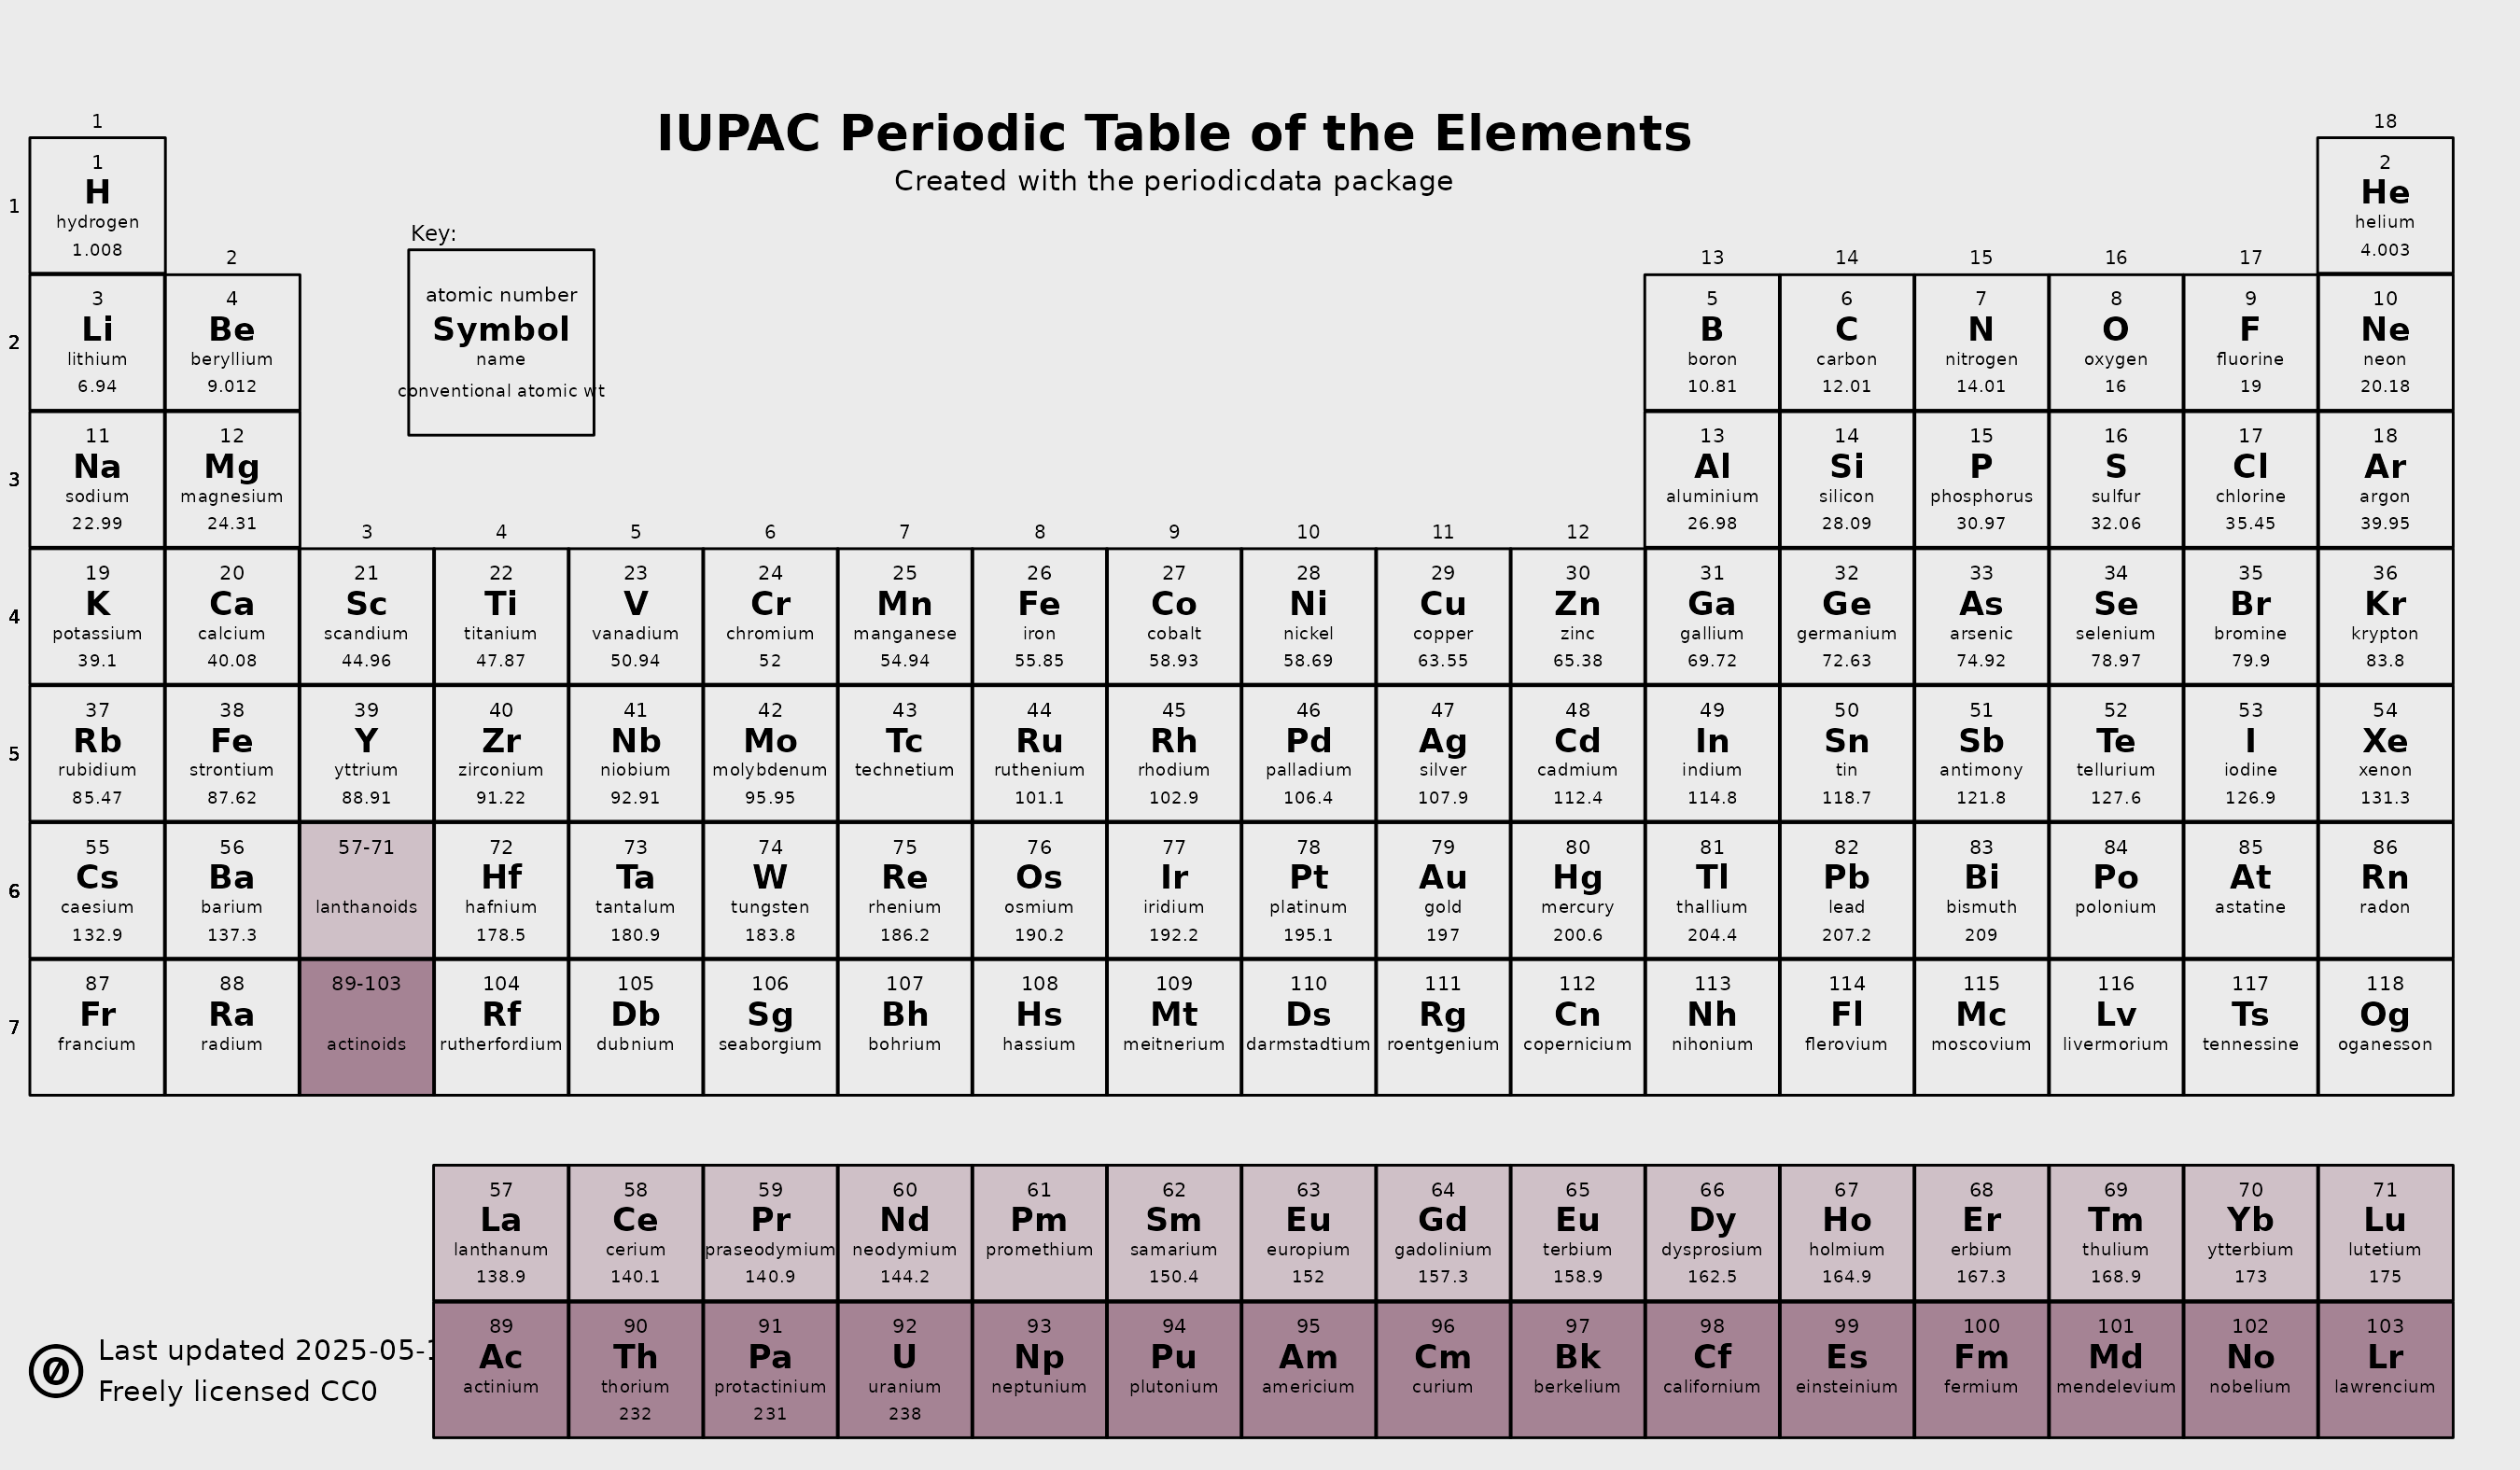
# periodicdata
<!-- badges: start -->
[](https://doi.org/10.5281/zenodo.5898567)
[](https://github.com/solarchemist/periodicdata#package-vignettes)
<!-- badges: end -->
This is an R *data* package with data in YAML format (for ease of entry and to
more easily keep track of metadata) including necessary R code to import said
data into a rectangularized tibble.
The dataset contains around 70 properties of the chemical elements.
The package has two vignettes; the first demonstrates how the YAML file is read
and saved into the tibble exported by this package, the second show-cases how
the data can be used to visualize different properties on the canvas of the
periodic table.
My hope is that this package will make it easier for chemists, teachers, and anyone
interested in chemistry to generate periodic tables of whatever trend they wish
to visualize.
<!-- PERIODIC TABLE -->
## Package vignettes
+ [Vignette #1: Importing data from YAML](https://htmlpreview.github.io/?https://github.com/solarchemist/periodicdata/blob/master/doc/periodicdata.html)
+ [Vignette #2: Show-case of data visualizations](https://htmlpreview.github.io/?https://github.com/solarchemist/periodicdata/blob/master/doc/showcase.html)
## Install this package
To install this package:
```
install.packages("remotes")
remotes::install_github("solarchemist/periodicdata")
```
To also build the vignettes when installing this package,
modify the last line to:
```
remotes::install_github("solarchemist/periodicdata", build_opts = c("--no-resave-data", "--no-manual"), build_vignettes = TRUE)
```
## Properties in this dataset
This list of all the properties in this dataset is dynamically
generated from the YAML dataset every time the vignette is rebuilt:
```{r, echo=FALSE, message=FALSE, results="asis"}
source(here::here("vignettes/code/generate-markdown.R"), local = knitr::knit_global())
```
## Contribute to this package
Your contributions are most welcome! Please report corrections as an issue or PR.
To add more data to the dataset, checkout this repository and edit the YAML file
`inst/extdata/periodicdata.yml`.
To rebuild the package, I recommend you run the provided bash script in `tools/`.
You will of course need **R**. Other rebuild requirements are
+ [`yq`](https://github.com/mikefarah/yq),
+ [`pajv`](https://github.com/json-schema-everywhere/pajv),
+ renv (use renv and the provided `renv.lock` file to install required R packages).
To checkout this repository:
```{bash, eval=FALSE}
$ git clone https://github.com/solarchemist/periodicdata.git
```
To rebuild the package after having made edits to the YAML data:
```{bash, eval=FALSE}
$ rebuild_package.sh --refresh-data
```
The rebuild script has more functionality; use the `--help` flag or read its
source code to familiarize yourself.
As part of the rebuild procedure `R CMD check` runs and should complete
without any errors, warnings, or notes.
## Other works citing this package
It is not really possible for me to keep track of how anyone uses this package,
nor do I have such an intention. But if you feel like letting me know how
you made use of this data or visualizations in your teaching or work, I will
gladly list you here!
+ [Chemistry Student Handbook](https://dornshuld.com/books/chemistry),
by prof. Eric Van Dornshuld, University of Georgia (2023). CC BY-NC-SA 4.0.
[Visualizes common periodic trends](https://dornshuld.com/books/chemistry/properties.html)
and [kindly credits me and this package](https://dornshuld.com/books/chemistry/periodic-table.html).
## Package history
I released this package in 2019 spurred by the International Year of Chemistry
([#IYPT2019](https://www.iypt2019.org)), building mostly on earlier work which
I had until then not packaged:
+ [Properties of the elements: data collection and ggplot2 tables](https://solarchemist.se/2014/11/16/element-data), Ahmed (2014)
+ [All available elemental properties plotted as periodic tables](https://solarchemist.se/2015/01/30/element-properties), Ahmed (2015)
These original web scraping scripts are preserved as package *articles* in the
vignettes directory, but no longer fill any role in maintaining this dataset.
## Links and notes
+ [Periodic table of elements by IUPAC](https://iupac.org/what-we-do/periodic-table-of-elements)
+ [periodictable.com](http://periodictable.com), provides "curated data provided by Mathematica's ElementData function from Wolfram Research, Inc." on their website as HTML/CSS tables
+ [Wolfram's `ElementData()` function](https://reference.wolfram.com/language/ref/ElementData.html)
+ [Wolfram's `ElementData()` function - sources](https://reference.wolfram.com/language/note/ElementDataSourceInformation.html)
+ https://periodic-table.io
+ [NIST Chemistry WebBook](https://webbook.nist.gov/chemistry)
+ [webelements.com](https://www.webelements.com) by Winter, M. (2007)
+ [Atomic Weights and Isotopic Compositions with Relative Atomic Masses, NIST Physical Measurement Laboratory](https://www.nist.gov/pml/atomic-weights-and-isotopic-compositions-relative-atomic-masses)
<!-- NUBASE contains experimentaly known nuclear properties, and some that have been estimated from extrapolation: mass, isomeric excitation energy, half-life, spin, parity, decay modes and intensities. -->
+ [NUBASE2020](https://amdc.impcas.ac.cn/web/nubase_en.html)
+ [Barbalace, K. "Periodic Table of Elements." 2007](https://environmentalchemistry.com/yogi/periodic)
+ [Elements in the Human Body and What They Do](https://sciencenotes.org/elements-in-the-human-body-and-what-they-do)
+ Vesborg & Jaramillo, Addressing the terawatt challenge: scalability in the supply of chemical elements for renewable energy. [RSC Advances 2, 7933–7947 (2012)](https://doi.org/10.1039/C2RA20839C).
### Other periodic table datasets
+ [pTable: equation balancer, solution calculator and chemistry database, Python (60 stars, ~30 properties)](https://github.com/GideonWolfe/pTable)
+ [Periodic elements data, npm (150+ stars, ~20 properties)](https://github.com/andrejewski/periodic-table)
+ [PeriodicTable.jl, Julia (120+ stars, ~20 properties with unitful physical quantities)](https://github.com/JuliaPhysics/PeriodicTable.jl)
+ [Periodic-Table-JSON, simply a JSON file (700+ stars, ~20 properties)](https://github.com/Bowserinator/Periodic-Table-JSON)
+ [Extensible periodic table with x-ray and neutron scattering data, Python (170+ stars)](https://github.com/python-periodictable/periodictable)
+ [PeriodicTable, R package on CRAN, ~25 properties](https://cran.r-project.org/web/packages/PeriodicTable/index.html) by Julien Idé, with data from [Data Explorer](http://www.data-explorer.com/data)
<!-- http://www.data-explorer.com/content/data/periodic-table-of-elements-csv.zip -->
+ [QCElemental, Python (190+ stars, exposes NIST CODATA, quantum chemistry data, and more)](https://github.com/MolSSI/QCElemental)
+ [GTK-Periodic-Table-Molecular-Formula, C++ (<10 stars, ~20 properties)](https://github.com/ekuester/Periodic-Table-Molecular-Formula)
+ [Periodica.Data, .NET (<10 stars, ~20 properties)](https://github.com/bluegrams/Periodica.Data)
+ [Chemistry Utility, Python script with JSON/spreadsheets (<10 stars, ~70 properties)](https://github.com/jwaitze/Chemistry-Calculations)
+ [Comprehensive Periodic Table of the Elements Scrape, Python script with JSON/spreadsheets (<10 stars, ~700 properties)](https://github.com/jwaitze/Periodic-Table-of-the-Elements-Data-Scrape)
+ [chemr, R package which uses Wikipedia's chemical elements data (<20 stars, ~10 properties)](https://github.com/paleolimbot/chemr)
+ [mendeleev package, Python (290+ stars, ~60 properties)](https://github.com/lmmentel/mendeleev). Authored by Łukasz Mentel. Project supported by the Norwegian Research Council.
+ [List of chemical elements, Wikipedia (~10 properties)](https://en.wikipedia.org/wiki/List_of_chemical_elements)
+ [NIST Chemistry WebBook](https://webbook.nist.gov/chemistry)
+ [NIST Atomic Weights and Isotopic Compositions with Relative Atomic Masses](https://www.nist.gov/pml/atomic-weights-and-isotopic-compositions-relative-atomic-masses)
### More notes on the periodic table
+ https://www.chemistryworld.com/opinion/symbols-and-tables-in-chemistry/4021317.article "Symbols and tables in chemistry", Vanessa Seifert, Chemistry World (Royal Society of Chemistry, 2025-05-12)
+ https://blog.oup.com/2019/01/happy-sesquicentennial-periodic-table-elements "Happy sesquicentennial to the periodic table of the elements", Eric Scerri, OUPblog (Oxford University Press, 2019-01-29)
+ https://blog.oup.com/2019/05/predicting-past-periodic-table "Predicting the past with the periodic table", Ben McFarland, OUPblog (Oxford University Press, 2019-05-31)
+ https://blog.wikimedia.org/2017/03/21/why-i-elements "Why I periodically write about the elements on Wikipedia", Mikhail Boldyrev, Diff (Wikimedia, 2017-03-21)