-
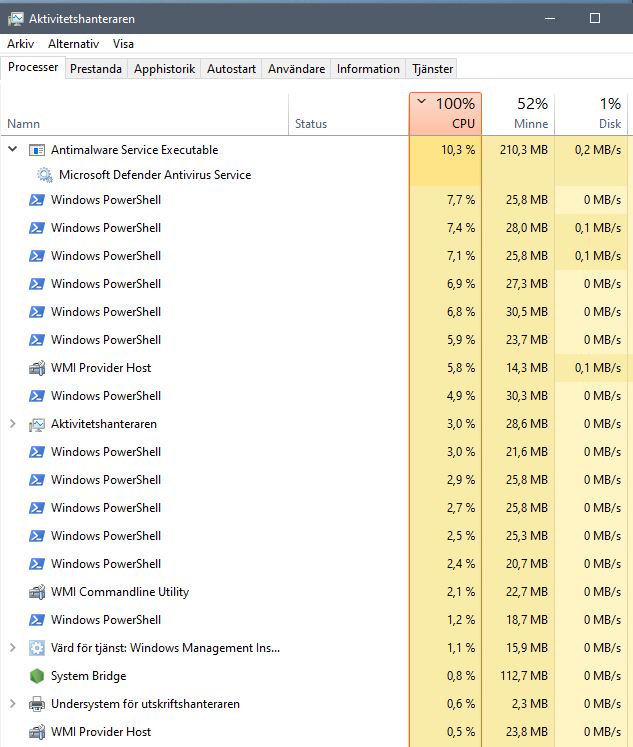
DescriptionFirst of all, thanks for your great work however I have an issue as follows: Is it expected that CPU Load goes to 100% during checking of new data?
What Platform / OS are you running?Windows What version are you running?19043.1110 Anything in the logs or a references that might be useful?No response Additional informationNo response |

Beta Was this translation helpful? Give feedback.
Replies: 4 comments 3 replies
-
|
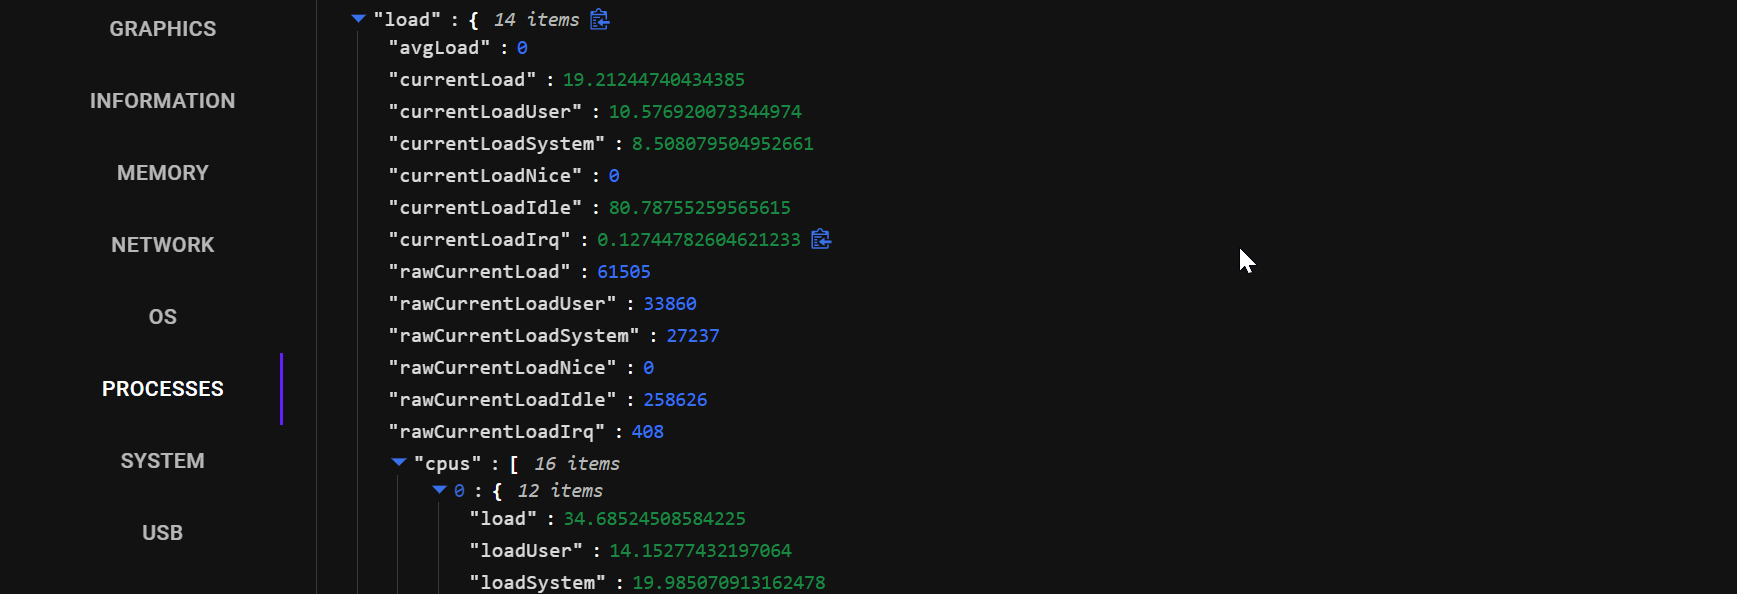
Does the CPU go straight back down afterwards? (You also have windows defender scanning so it might be throwing things off) I'm thinking we may want to split these intervals so the observer checks for changes for each endpoint independently instead of running all checks at once. I've not seen a spike show up in the data frontend however:
This may work differently though |
Beta Was this translation helpful? Give feedback.
-
|
Yes, it goes down again afterwards until next 30 seconds have passed.. I also noticed windows defender scanning but it actually peaks only at the same time as the other processes peak, then also goes down. |
Beta Was this translation helpful? Give feedback.
-
|
#713 Should help. I've also have opened a few more issues which should decrease overall load by reducing the amount of tasks the observer does |
Beta Was this translation helpful? Give feedback.
-
|
Hey @timmo001, any chance you can do beta release soon to test improvements so far? 2.5.0 makes complete system unusable here, it spawns those processes over and over and CPU is working 200% all the time... |
Beta Was this translation helpful? Give feedback.
-
|
I plan on releasing soon. Currently #739 is blocking a release as you can only run the app for a few before it silently crashes. If you are feeling daring though, you can download one of the artifacts from the CI pipeline which the releases source from. https://github.com/timmo001/system-bridge/actions/workflows/ci.yml |
Beta Was this translation helpful? Give feedback.
-
|
Hey, thanks. I got the CI artifact and installed that. Here are some things you might consider improving. |
Beta Was this translation helpful? Give feedback.
-
|
Hello guys, Has this setting been removed or am I overseeing something? I use the current version 3.4.4. Thank you for your support. |
Beta Was this translation helpful? Give feedback.
#713 Should help. I've also have opened a few more issues which should decrease overall load by reducing the amount of tasks the observer does