Funny behavior of argument scale in geom_vridgeline #47
Description
Consider the following simulated data:
library(tidyverse)
library(ggridges)

# markov chain parameters
mu = 8                           # cm/hr
sigma = 4                        # cm/sqrt(hr)
x0 = 3                           # initial condition
tmax = 200                       # end time
deltat = 10                      # time increment (hrs)
reps = 300                       # number of realizations

random_walk = function()
  c(0, cumsum(mu*deltat + sigma*rnorm(n, sd = deltat))) + x0

# simulate random walks
n = tmax/deltat
res = cbind.data.frame(seq(0,tmax, by = deltat), replicate(reps, random_walk()))
names(res) = c("time", paste("run", seq(1, ncol(res) - 1)))
# format the data for plotting
res.plot = gather(res, run, x, -time)
I want to plot the distribution of values at select times as density ridgelines. This works perfectly with geom_vridgeline when a subset of the data is used:
# extract specific times to compute marginal densities
res.select = filter(res.plot, time %in% c(50, 100, 150))

ggplot(res.plot, aes(x = time, y = x, group = run)) +
  xlab("t (hrs)") + ylab("x(t) (cm)") + theme_bw() +
  # raw data
  geom_line(color = "black", alpha = 0.1) +
  geom_vridgeline(data = res.select, aes(group = time, width = ..density..),
    stat = "ydensity", scale = 5000, fill = NA, color = "red", size = 1)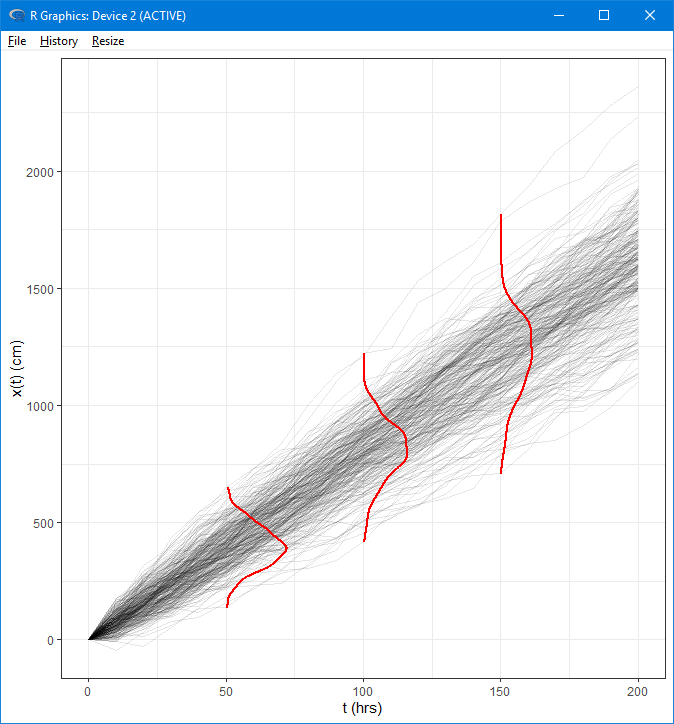
However, it doesn't work so well when I try to this with the full dataset:
ggplot(res.plot, aes(x = time, y = x, group = run)) +
  xlab("t (hrs)") + ylab("x(t) (cm)") + theme_bw() +
  # raw data
  geom_line(color = "black", alpha = 0.1) +
  geom_vridgeline(aes(group = time, width = ..density..),
    stat = "ydensity", scale = 5000, fill = NA, color = "red",
    size = 1)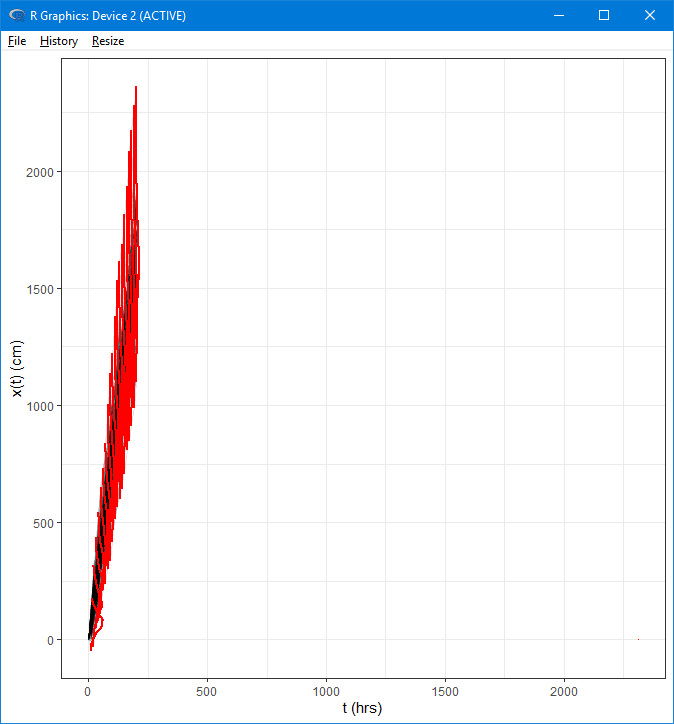
The issue seems to be the scale argument which ends up expanding the y-axis. If I reduce the value of scale, the scale is expanded less but I lose the width of the ridglines:
ggplot(res.plot, aes(x = time, y = x, group = run)) +
  xlab("t (hrs)") + ylab("x(t) (cm)") + theme_bw() +
  # raw data
  geom_line(color = "black", alpha = 0.1) +
  geom_vridgeline(aes(group = time, width = ..density..),
    stat = "ydensity", scale = 700, fill = NA, color = "red",
    size = 1)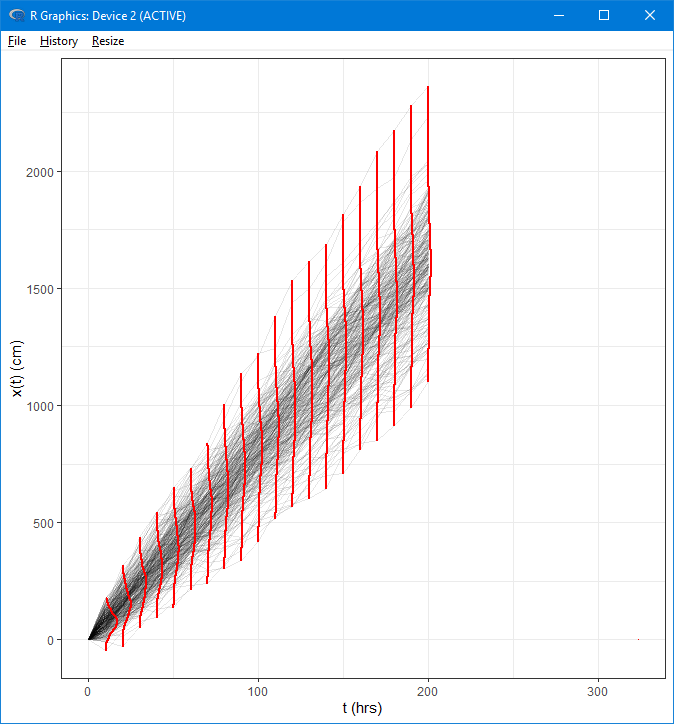
Is this a bug, or am I misunderstanding something about the arguments?