The Ecowatt API is made available by RTE for the purpose of exposing the ecoWatt signal
This signal is intended for actors in the electricity market and the general public (citizens and local authorities) to provide warnings at three levels of consumption.
In this repository, we will :
- Use ecowatt API
- Collect daily signals data and write it on a MySQL database. (ecowatt API doesn't provide historical data)
- Exposing the historical daily signals by a Flask API
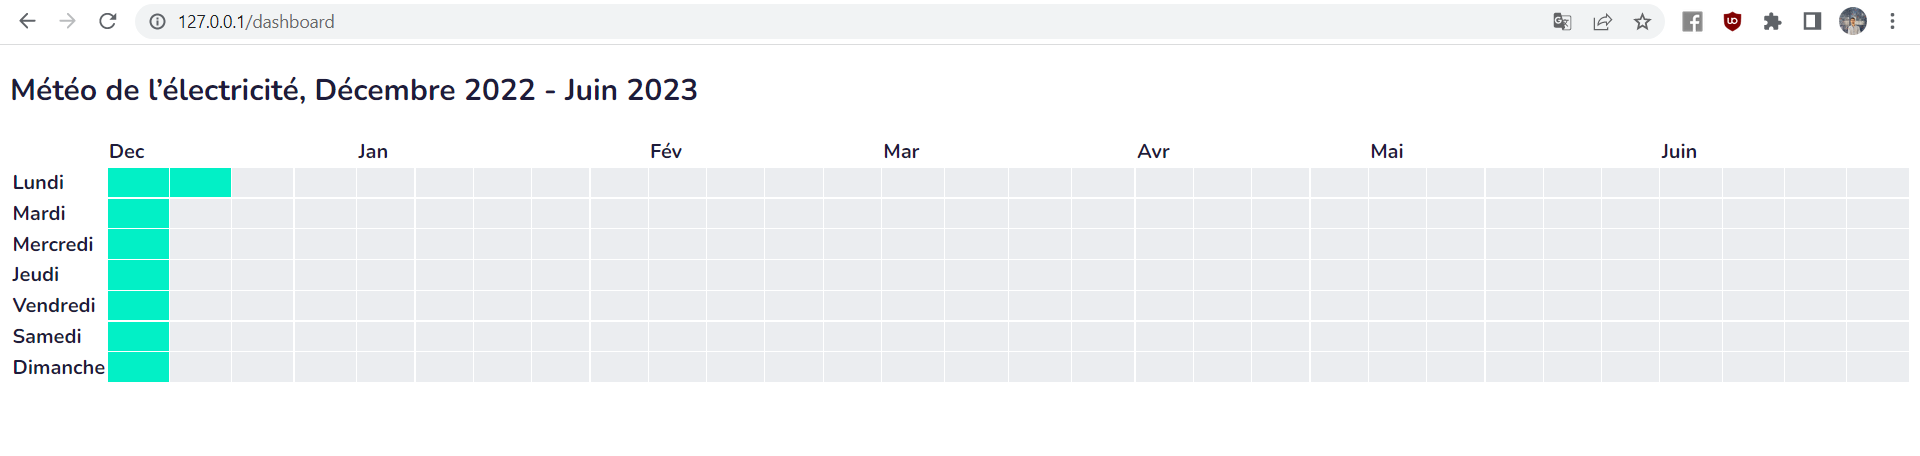
- Visualize the exposed data in a heatmap ( I didn't find free JS library that provide heatmap chart, so I made something that looks like a heatmap by using an html table and css)
You should have already a MySQL server running on your machine, you may need to do some changes on the code (database name, user, password, ...)