In this repository, you can find bulk ATAC-seq script for healthy human bone marrow samples. This ATAC-seq pipeline is both straightforward and reproducible, covering everything from raw FASTQ files to transcription factor activity and generating a signal track file (bigwig). It can handle both single-end and paired-end data. Detailed error reporting is provided, and the pipeline allows for the easy resumption of interrupted runs. This pipeline is run using Linux and R.
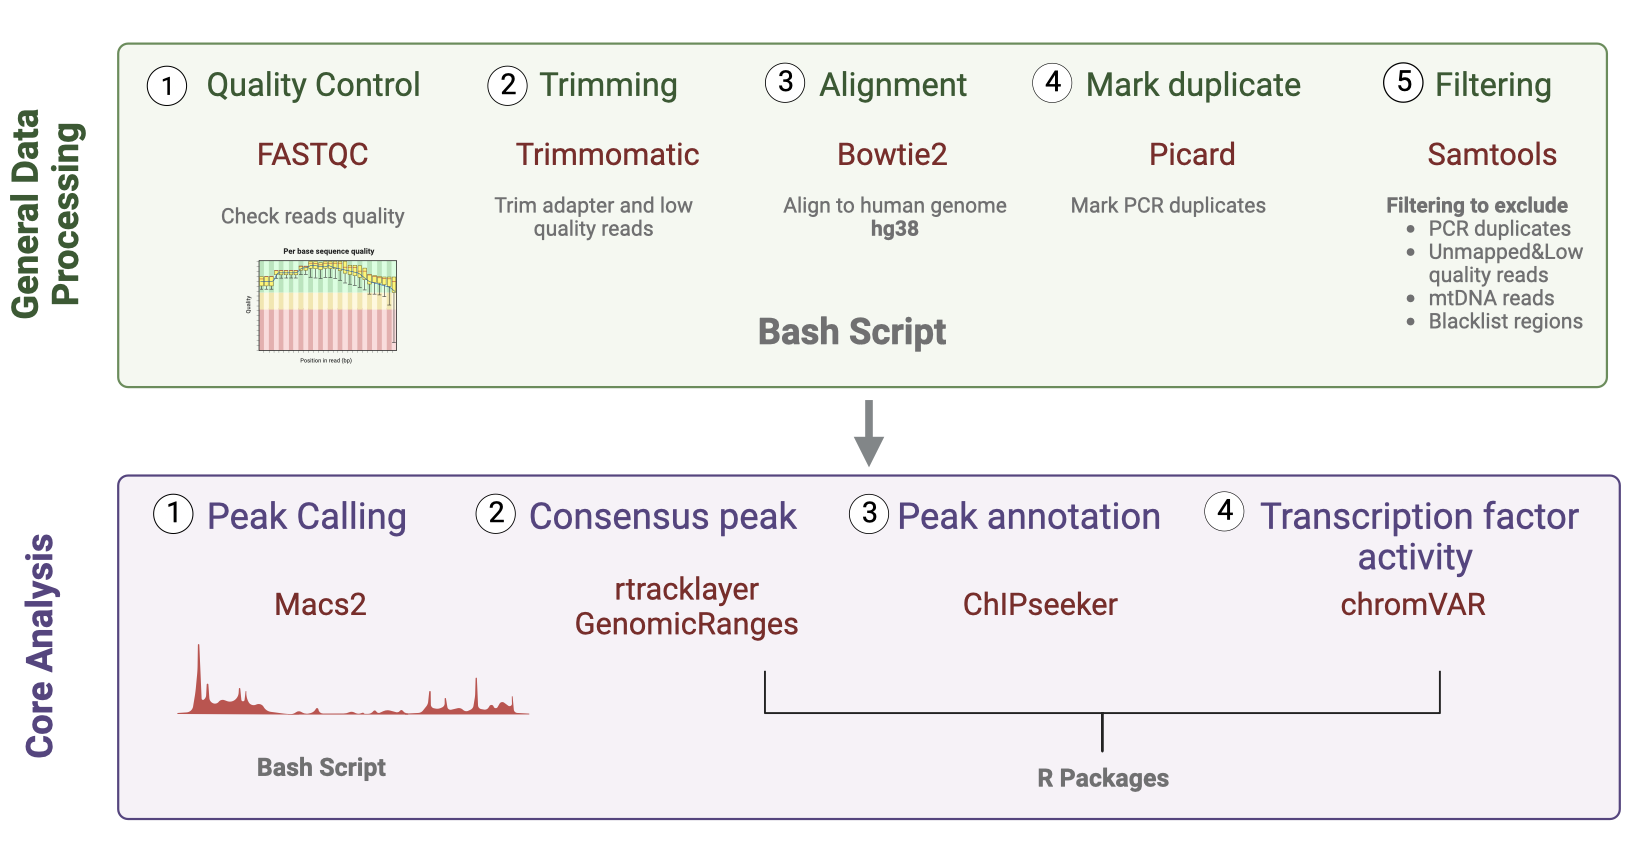
The figure below provides an overview of all the steps involved, along with the corresponding tools and programming language.
Using IBEX cluster with 20 cpus-per-task
-
fastqc/0.11.8
-
trimmomatic/0.38
-
Alignment bowtie2/2.3.5
-
Convert sam to bam, sorting and indexing, mark duplicate QC and filtering samtools/1.8
-
Mark duplicate picard/2.20.4
-
Peak Calling macs2/2.1.1.2/anaconda2-2.5.0
-
Frip scores - manuel equation bedtools/2.29.0
-
Visualization (bigwig) deeptools/python2.7/3.3.1
-
MultiQC multiqc/1.9
R version 4.2.2 (2022-10-31) Platform: aarch64-apple-darwin20 (64-bit) Running under: macOS Monterey 12.4
- Consensus peak
rtracklayer_1.58.0
GenomicRanges_1.50.2
- Consensus peak similarity between cell types (Heatmap and MDS)
Jaccard
- Count table
Multicov function from bedtools 2.29.0
- Peak annotation
ChIPseeker v1.34.1
TxDb.Hsapiens.UCSC.hg38.knownGene
GenomicFeatures
AnnotationDbi
GenomicRanges_1.50.2
rtracklayer_1.58.0
clusterProfiler v4.6.0
- Transcription factor activity
chromVAR_1.20.2
Motifmatchr_1.20.0
Matrix_1.5-3
SummarizedExperiment_1.28.0
BiocParallel_1.32.5
BSgenome.Hsapiens.UCSC.hg38_1.4.5
Open (00_runATAC.sh) in a text editor and make the necessary changes by editing the path according to your file, and updating the tools and files or variables name. After that go to (01_templateATAC.sh) and make sure that the changes you made in runATAC.sh are updated in the template.
To run the script from FASTQC to peak calling for each sample do the following:
bash 00_runATAC.sh "sample_name"
After that, all the files and reports will be generated for each sample.
Genome Browser
You can use the links in the ATAC_BM_TrackHub.odt, which are bigwig files for each cell type and visualize the peaks in the genome browser.
First, merge all narrowpeak files for each cell type to use it for consensus peak and then run the (02_consensus_peaks.Rmd) file in R.
For consensus peaks QC, run (03_Jaccard_heatmap.sh) This will perform a loop between all bed files from different cell types in the pairwise_jaccard.txt file. This file will be used in (04_jaccard_samples.R) to create the jacccard heatmap and MDS similarity.
Before doing the peak annotation we need to do a count table to get the peaks that overlap between clean.bam files from all samples bed files for all cell types using bash script (05_bedCount.sh) with the function multicov.
(06_peak_annotation.R) using the consensus peak for all cell types to annotate the peaks into genomic coordinates of each peak with nearby genes, functional elements, or other genomic features.
(07_chromVAR_TF .R) has a detailed explanation of the process to determine transcription factor activity using chromVAR.