The goal of this project is to analyze FITBIT fitness data to discover opportunities for Bellabeat’s business. Specifically, I will analyze the consumer data to learn how consumers are using their devices, which will help guide Bellabeat’s marketing direction.
- What are some trends in smart device usage?
- How could these trends apply to Bellabeat customers?
- How could these trends help influence Bellabeat marketing strategy?
I will follow the steps of the data analysis process: ask, prepare, process, analyze, share, and act.
- A clear summary of the business task
- A description of all data sources used
- Documentation of any cleaning or manipulation of data
- A summary of your analysis
- Supporting visualizations and key findings
- Your top high-level content recommendations based on your analysis
The objective is to analyze user data to derive insights into how consumers use fitness products. After uncovering these insights, the analytics team is to apply what they have learned to one Bellabeat product and recommend opportunities for improving or creating new marketing strategies.
Urška Sršen, Bellabeat’s cofounder and Chief Creative Officer; Sando Mur, Bellabeat’s other cofounder and key team member; and Bellabeat's marketing analytics team.
The second step for analyzing data is the prepare phase. This phase involves determining what data is appropriate for our analysis, ensuring the data is credible and ethical, as well as properly accessing and organizing the data.
The data I will be using for this analysis was already provided to me, so I will not be collecting any additional data for this project. Knowing where the data is stored and who created it is an important step in validating the data. The dataset for this project was created by Möbius and is publicly availble on Kaggle, found here.
The explanation for each measurment in the dataset is present here.
In terms of credibility, on the surface this data shows some concerns. For instance, the data only has 30 unique identifiers, which is an extremely small sample of the entire population. However, in order to fully assess the validity of this dataset, let's see if it "ROCCCs." Below the acronym is filled out, along with a spectrum of ratings where 1 represents a weak aspect of the data and 5 represents a strong aspect of the data.
R - Reliability (2 out of 5). : It is unclear as to whether the data collected was randomly distributed. In addition, with data collected from only 30 participants, our dataset is quite small and thus possibly not representative of the true population. However, the data seems to be collected from a well-established company (see "Cited" below), which lends it some credibility.
O - Originality (2 out of 5). : The data was collected from a third-party entity, Amazon Mechanical Turk. There is limited information on how the surveys were collected or distributed, so we can not be sure if they are random. This could be problematic because of its potential for bias - without random sampling we are not getting a true picture of the overall population.
C - Comprehensive (2 out of 5). : The dataset is not very comprehensive - it only encompasses the data from 30 individuals. Additionally, with the data being collected only over a span of two months, it is not comprehensive. In other words, we are unable to determine whether fitness tech usage changes month-over-month as we are missing 10 months' worth of data.
C - Current (3 out of 5). : The dataset was released on Kaggle in January 2021, about six months before writing this project. However, the data itself was taken from March 12, 2016 through May 12, 2016. This means the data is 5 years outdated and, subsequently, may not be reliable.
C - Cited (4 out of 5). : The dataset is cited from a place called Zenodo which, after a brief Google search, seems to be a fairly reputable website where large data can be shared publicly and used by anyone interested in accessing it. In addition, the data is said to be collected from researchers (Robert Furberg, Julia Brinton, Michael Keating, and Alexa Ortiz) from RTI International, a well-established non-profit organization providing research and technical services.
The dataset clearly is not the most comprehensive, so my analysis likely will not fully represent the population. The data provided will help identify trends in Bellabeat users specifically, which is what Bellabeat is looking for; however, the analysis would likely be more representative and insightful if used alongside another dataset and/or additional information collected by Bellabeat.
Tools: R(Statistical Programming Language), one to most comprehensive tools for data cleaning, transforming and visualizing. Different R Packages were used to conduct the aforementioned tasks
- Check for missing values
- Check for duplicates
- Finding Primary Key
- Checking for Unique ID
- Clean column names
- Convert date and time columns to appropriate type and format
- Create a weekday column
- Drop unnecessary columns
- Creating different dataframes to get data ready to be analysed
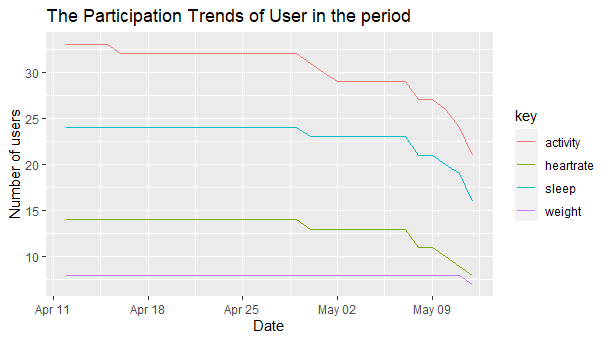
The number of users of each features are greatly different. Among 33 users participating, there are:
- 72% (24 users) have tried sleep tracking
- 42% (14 users) have tried heartrate tracking
- Only 24% (8 users) have tried weight tracking
- The number of user each day ranges from 21 users in the last day to 33 users, with mean of 30 users
- The number of user participating starts to drop after 16 days with increasing rate. After 4 weeks, about 1/3 of users stopped using the tracker
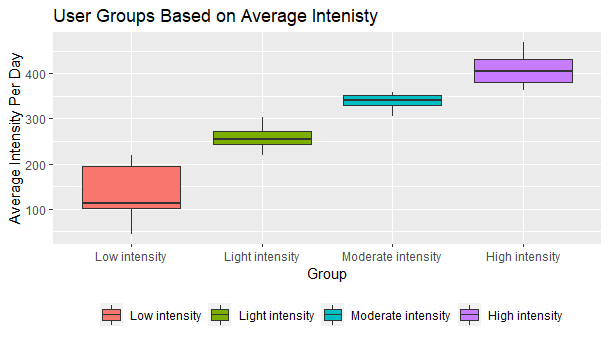
- Low intensity users tend to have an average intensity per day less than 200
- Light intensity users tend to have an average intensity per day around 250
- Moderate intensity users tend to have an average intensity per day near 350
- High intensity users tend to have an average intensity around 400
- 6 users have lack of sleep and 10 users have average enough sleep.
- The average hours of "Enough sleep" group is 7.6 hours.
- The average hours of "Lack of sleep" group is 6.1 hours.
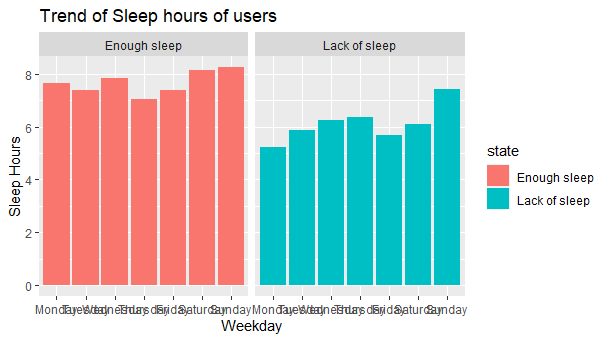
- Both group sleep the most on Sunday but their other weekdays have seen different sleep trend leading up to Sunday
- While "Enough sleep" group sleep the least at the middle of the week, users with lack of sleep deprives most sleep on Monday
- For users with enough sleep, they sleep the more on both saturday and sunday, but for users with lack of sleep, they only sleep more on Sunday
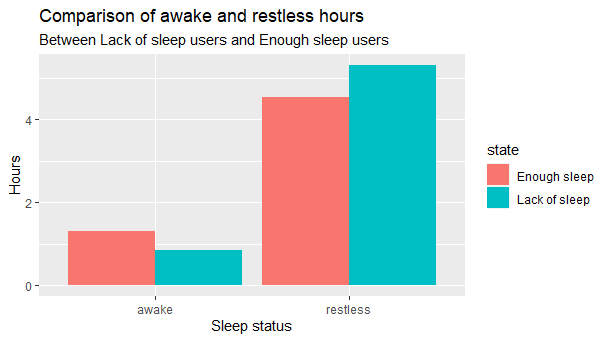
- Users with lack of sleep have to go through longer hours of restlessness, which may be part of the reason.
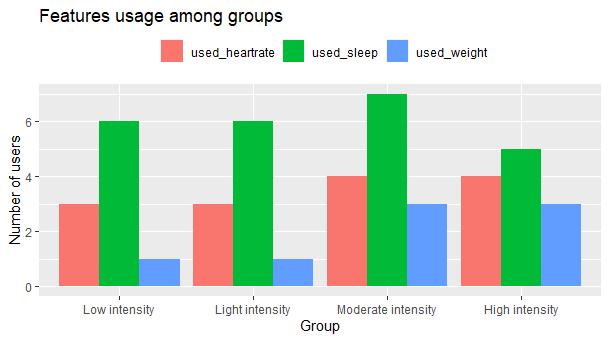
- Most users in every group used sleep tracking feature
- A portion of user in each groups may be willing to try out other tracking features such as heartrate or weight
- Moderate intensity and high intensity users tend to measure their weight and heart rate also
- However, the sample is small and should be investigated with a larger scale to reach a conclusion
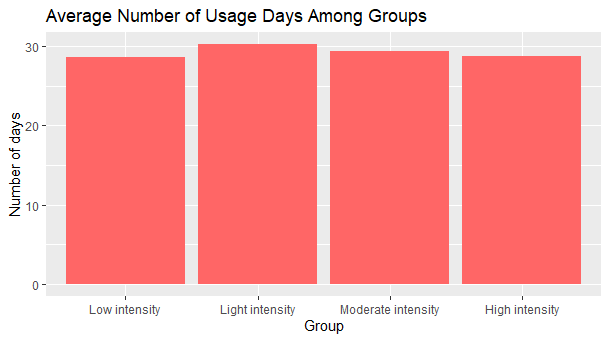
- There are not much difference in the average usage days among groups
- Interestingly, even if the user have low or light intensity, they tend to stick with the tracking system as long as high int
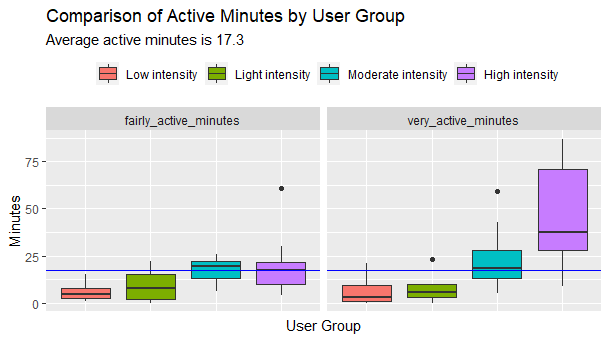
- High intensity group mainly performs active sessions in their active periods, while moderate intensity group has more equal amount of very active minutes and fairly active minutes
- Low intensity and light intensity group have very short active periods throughout their day
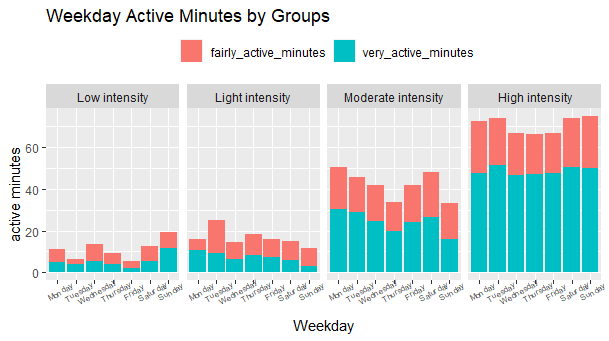
- High intensity group has consistent routine for their active minutes, they make sure that they spend more than an hour every day for active activities, and more active in the start and end of the week
- Moderate group has around 30 - 50 minutes of active minutes each day, with the lowest days are Sunday and Thrusday
- Low intensity group and Light intensity group have less than 20 minutes of active minutes each day
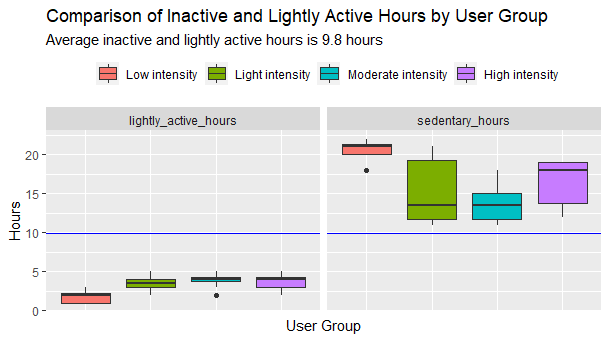
- There is abnormal amount of sedentary hours among low intensity users. This indicate the measured data might be inaccurate due to devices not working, or this group of user had to sit for too long and do not need to move throughout their day. They have very low activity time throughout the days for all types of active activities
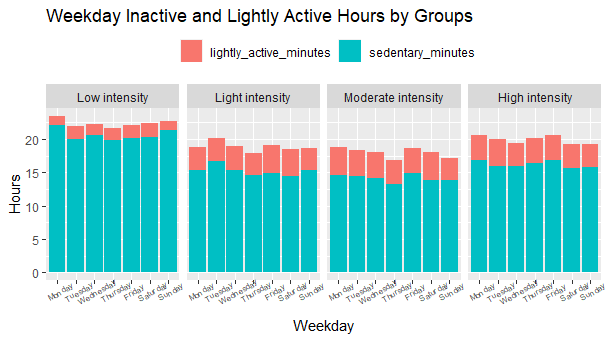
- Surprisingly, High intensity group users also have higher sedentary minutes than moderate and light intensity groups. This is probably due to they actively track their activity more frequently than other groups.
- For others, they may neglect their tracking devices in cases when out of batteries or not tracker not working.
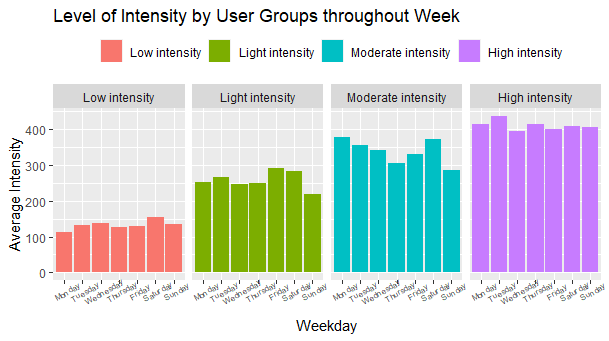
- High intensity group: Intensity is high throughout
- Moderate intensity: They have high intensity but have inconsitent pattern between each day of week
- Light intensity: They have relatively high level of intensity at the end of week, and rest on sunday
- Low intensity: low intensity throughout the wee
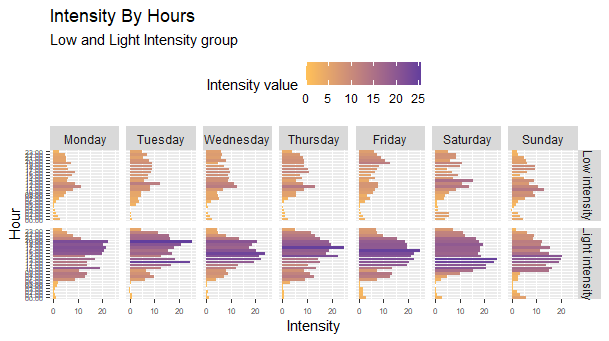
- Low intensity group: intensity throughout week is consistent, which tend to the value peaks at noon time
- Light intensity group: on weekday, they are more active in the afternoon and evening, while on weekend, their most active period is at noon
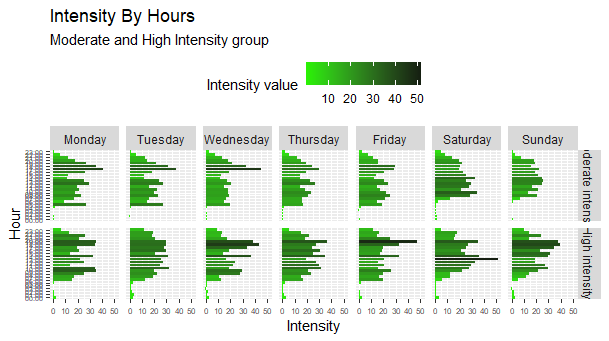
- These 2 groups tend to have certain very active hour each day throughout the week
- However, for moderate intensity group, there are different active periods between weekend and weekdays, in weekend they are more active at noon while on weekdays, their peak hours are the evening
- The peak active hours are from 17:00 to 19:00
- Low intensity users (Avg intensity per day < 200): These users are usually inactive throughout their day. Most intensity in a day comes from low intensity walking
- Light intensity users (Avg intensity per day around 250): These users have around 15 - 20 minutes of daily active minutes, most of which involves walking or running. They have some periods of exercise around the week, mainly afterwork or on weekend morning.
- Moderate intensity users (Avg intensity per day around 350): They perform about 30 - 50 active minutes a day , especially walking or running. Their habits are similar to light intensity users but with higher intensity, they tend to perform exercise afterwork and on weekend morning.
- High intensity users (Avg intensity per day around 400): They perform a lot of intense work out exercise, they have at least 1 hour of active minutes a day with slightly higher at the start and end of the week. They follow strict workout routines with exact hours for working out each day.
Only 42 % users use heartrate tracking and 24% users use weight tracking. For weight tracking, perhaps most users seem its too much effort to enter weight data manually and for heartrate, some people might see it as unnecessary.
- Some users start to stop using their devices after 3 weeks.
- Moderate user and high intensity user may have more chance of tracking weight and heart rate.
- The churn rate in the sample are not different among user groups, which means a user who do not work out alot has the same chance of stop tracking as a user who exercise intensely everyday. However, the sample size is too small to confirm these claims and require further analysis.
- A large proportion (37.5%) of the sample have average lack of sleep.
- Both groups tend to sleep the most on Sunday but with different trends throughout the week
- Lack of sleep users also witness higher amount of restlessness.
Based on the findings in the analysis, I provide the following recommendations for the Bellabeat App and Membership Program:
Because user stickiness to use the tracking features among groups are not different, it is recommended that the user acquisition for the app should be targetted widely, including both people with already healthy fitness habits and people with high inactivity. However, the approach of the app should be different for each groups.
High intensity group: The app should aim to maintain their current good habit by acting as a reliable reminder for their daily workout period, and promote a wide variety of intense workout.
Low intensity group: The app should aim to encourage these users to take small steps in their workout and exercise by acting as an encouraging friend. Eg. Alerting long inactivity period and encourage them to take a brisk walk or stretch their body.
Moderate and light intensity groups: The app should aim to give them a push to help them become a high intensity user by acting as an encouraging coach. Eg. encourage them to increase the workout periods for 5 minutes that day or feature short intense exercises for them to add to their periods.
- For users with lack of sleep, the app should personalized feature posts for them improve sleep quality such as lowering stress and mindfulness habits.
- Because some users may only use 1 or 2 tracking features, the app should have posts emphasizing the benefits of tracking multiple areas of their health habit to improving overall wellbeing.