Live: FaDMS
FaDMS is a data visualization of the differing levels of success movies have in foreign and domestic markets. As the number of movie consumers in foreign markets grow, it is imperative to understand what movies are successful not just at home, but overseas as well.
Unlikes other movie visualizations, FaDMS focuses on the foreign movie market over time with varying kinds of movies. The y-axis of the graph is the percent of total box office revenue that came from foreign markets. Between the different data sets, the top 100 biggest box office hits had the highest percent of their total revenue from foreign markets, hinting the greater importance of this market for commercial success.
After 1990 when there is better data for foreign markets, we see a stagnation for Oscar Best Picture Winners for their percentage from foreign markets. On the flip-side, IMDb's 250 highest rated films see a slight increase in percent from foreign markets. This may hint towards a slight bias for films that reverberate more with domestic audiences amongst the Academy Award voters.
In FaDMS, users will be able to:
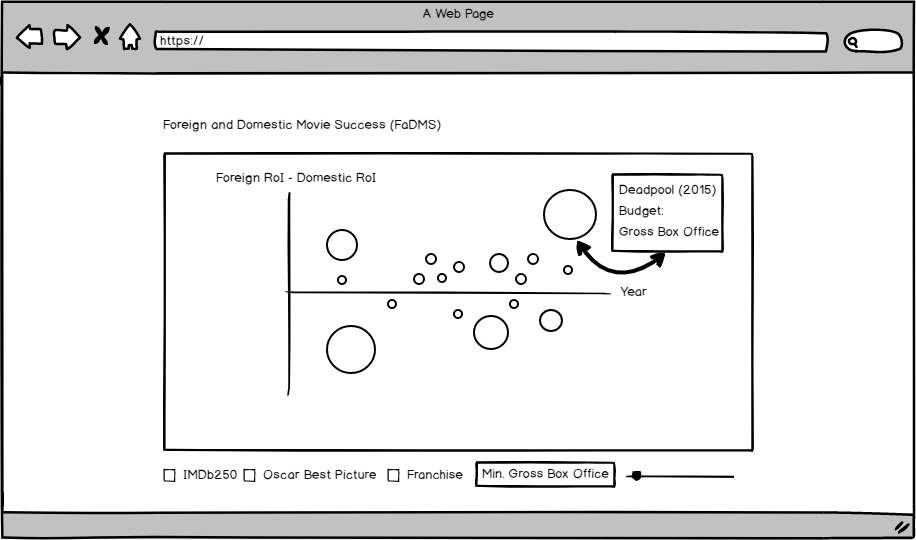
- see the difference in foreign and domestic box office success for their favorite movies
- hover over the movie to see a detailed breakdown of the movie's stats
- choose selectors such as IMDb Top 250, and Oscar Best Picture winners
FaDMS is a single page app that displays an interactive scatterplot with each point's size depending on the gross profit. The x-axis will be the year of the movie's release and the y-axis will the percent of the gross movie revenue that came from foreign markets.
When a user hovers over a point, the movie's name and information will pop up.
This project will be implemneted with the following technologies:
- Vanilla JavaScript for overall structure
- D3 for DOM manipulation
- Webpack to bundle
There will be 2 scripts involved in this project:
movies.jsx- deals with each individual movie itemselector.js- deals with handling which group to call (Oscar Winners, IMDb 250, Franchises, All, etc)graph.js- handles calculations and graph rendering
- Research D3 and run through its tutorial
- Set up index.html and render base of graph (Circles and Axis)
- Retrieve IMDB API or The Numbers' API and have selected group show
- Render hover data for each movie
- CSS for the website
- Scrollbar for minimum Gross Revenue
- Selector for different movie studios