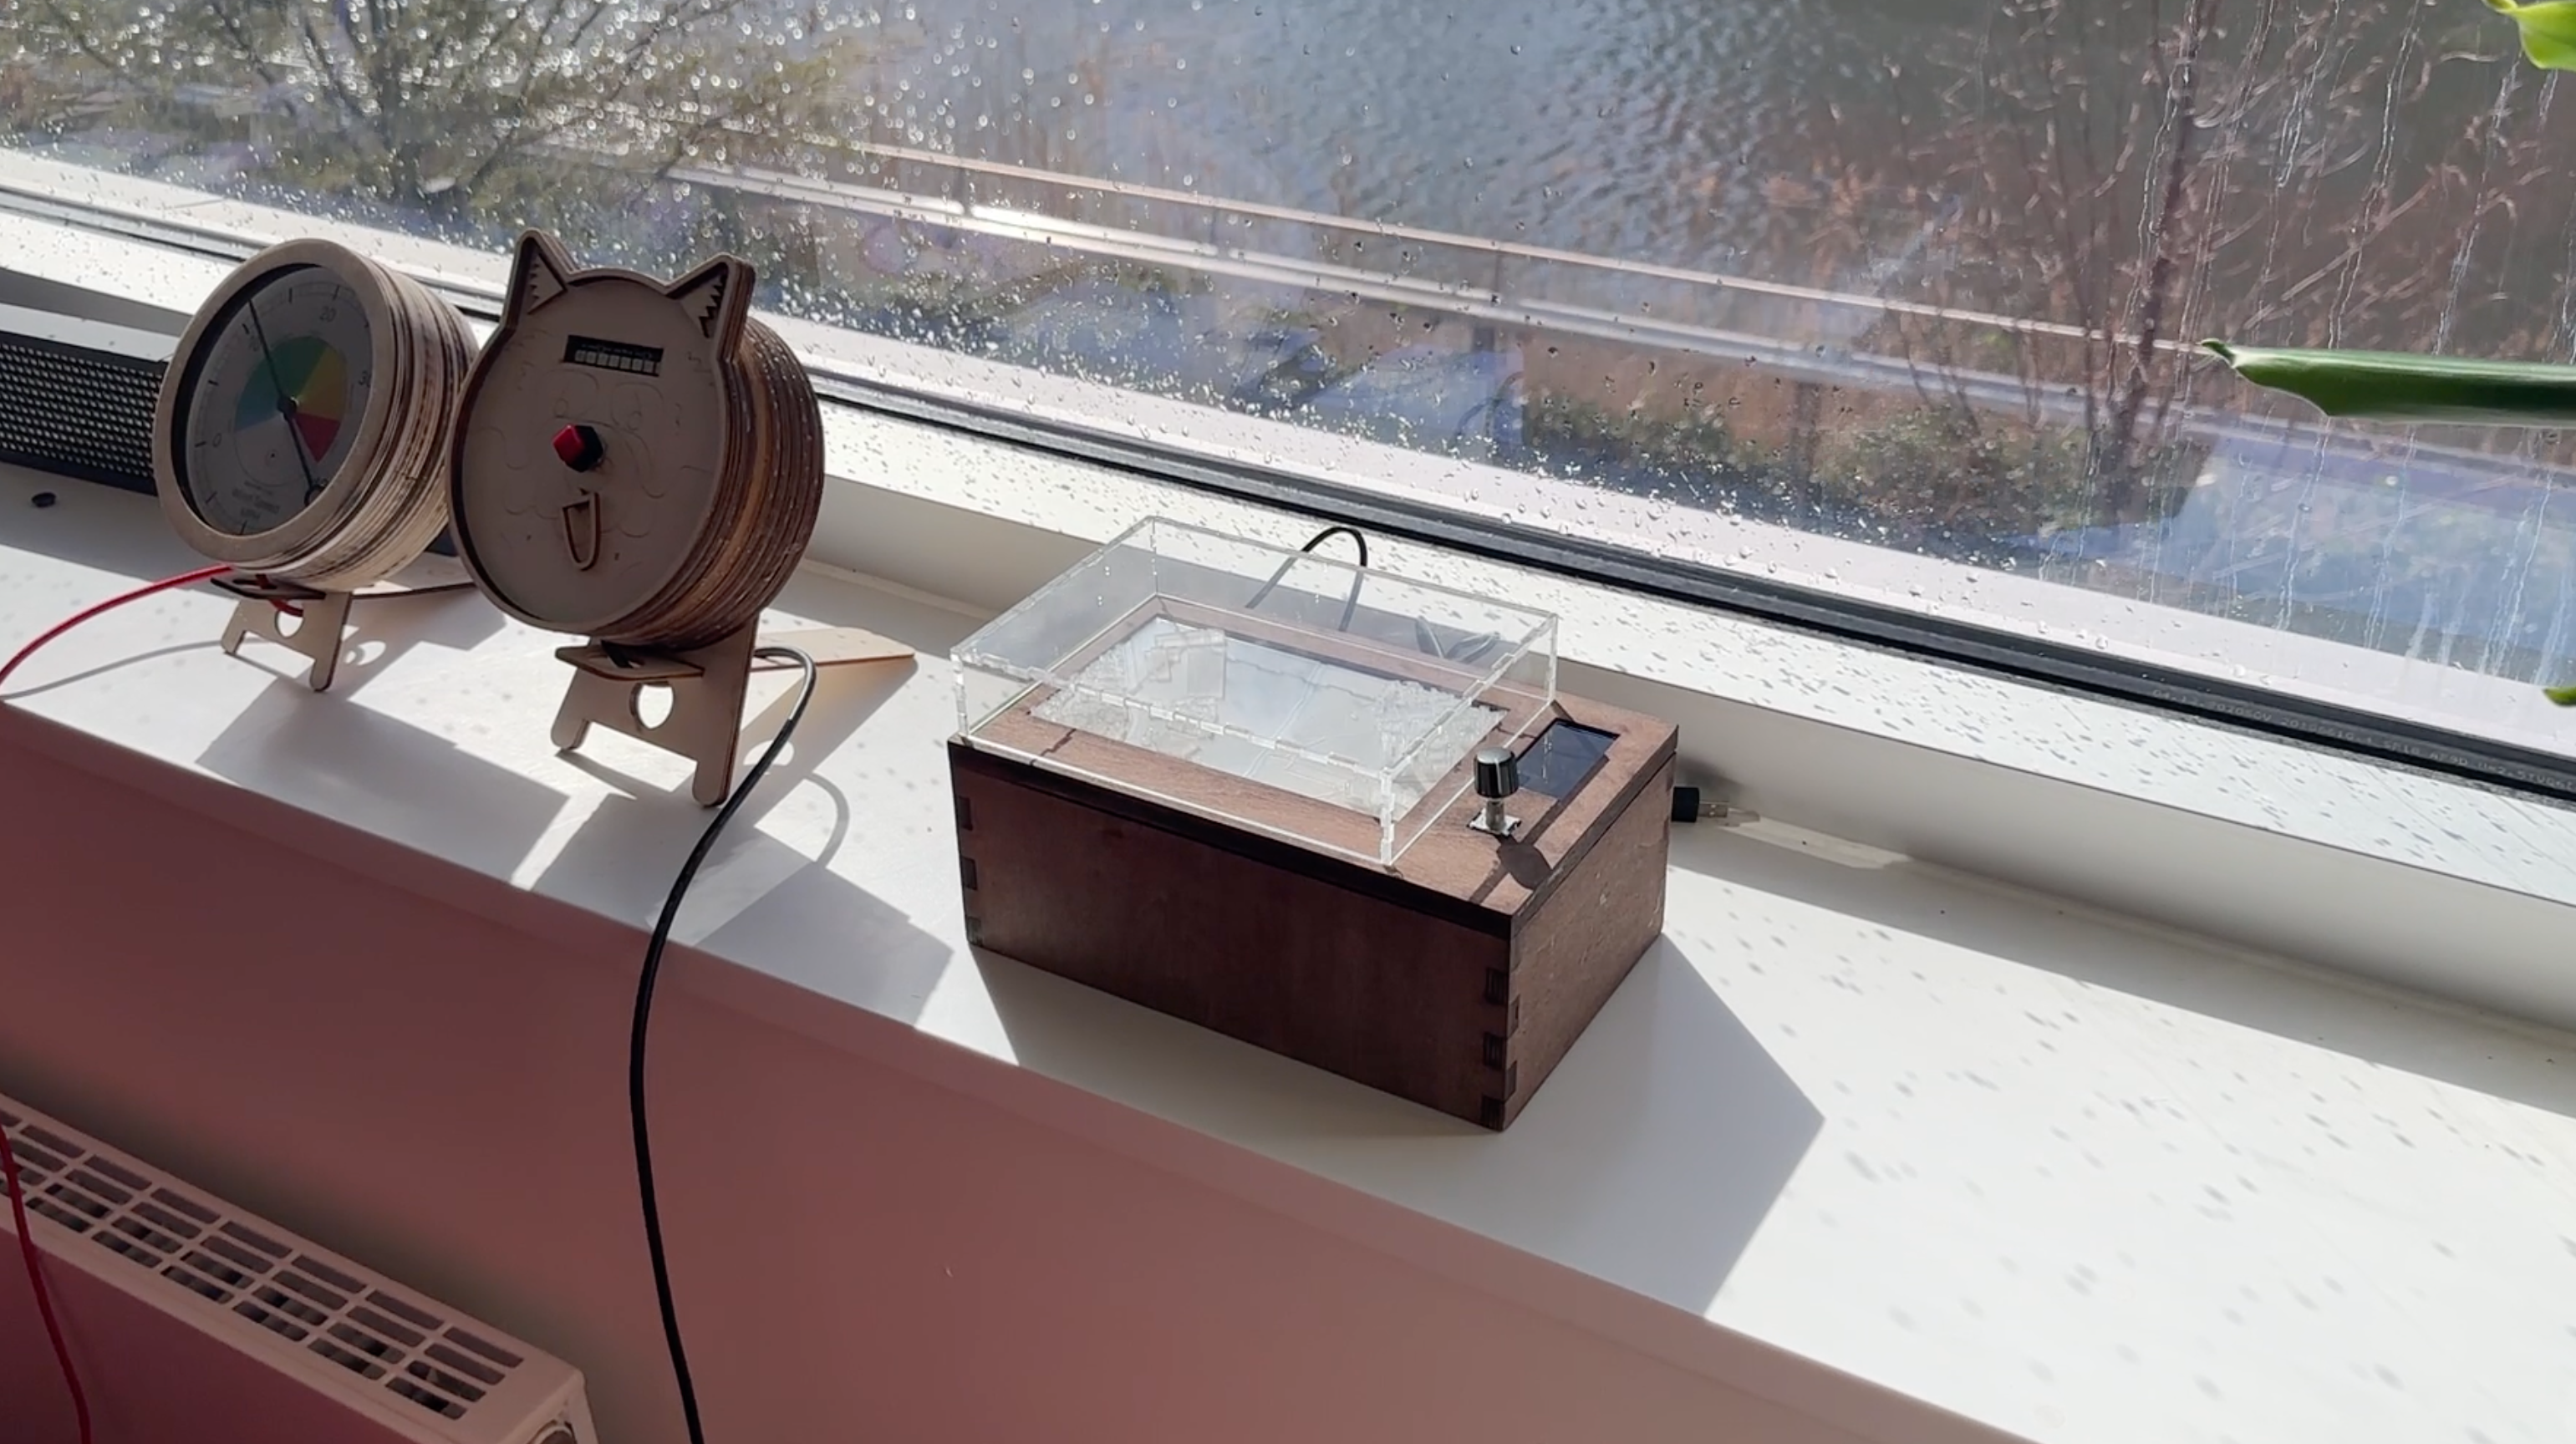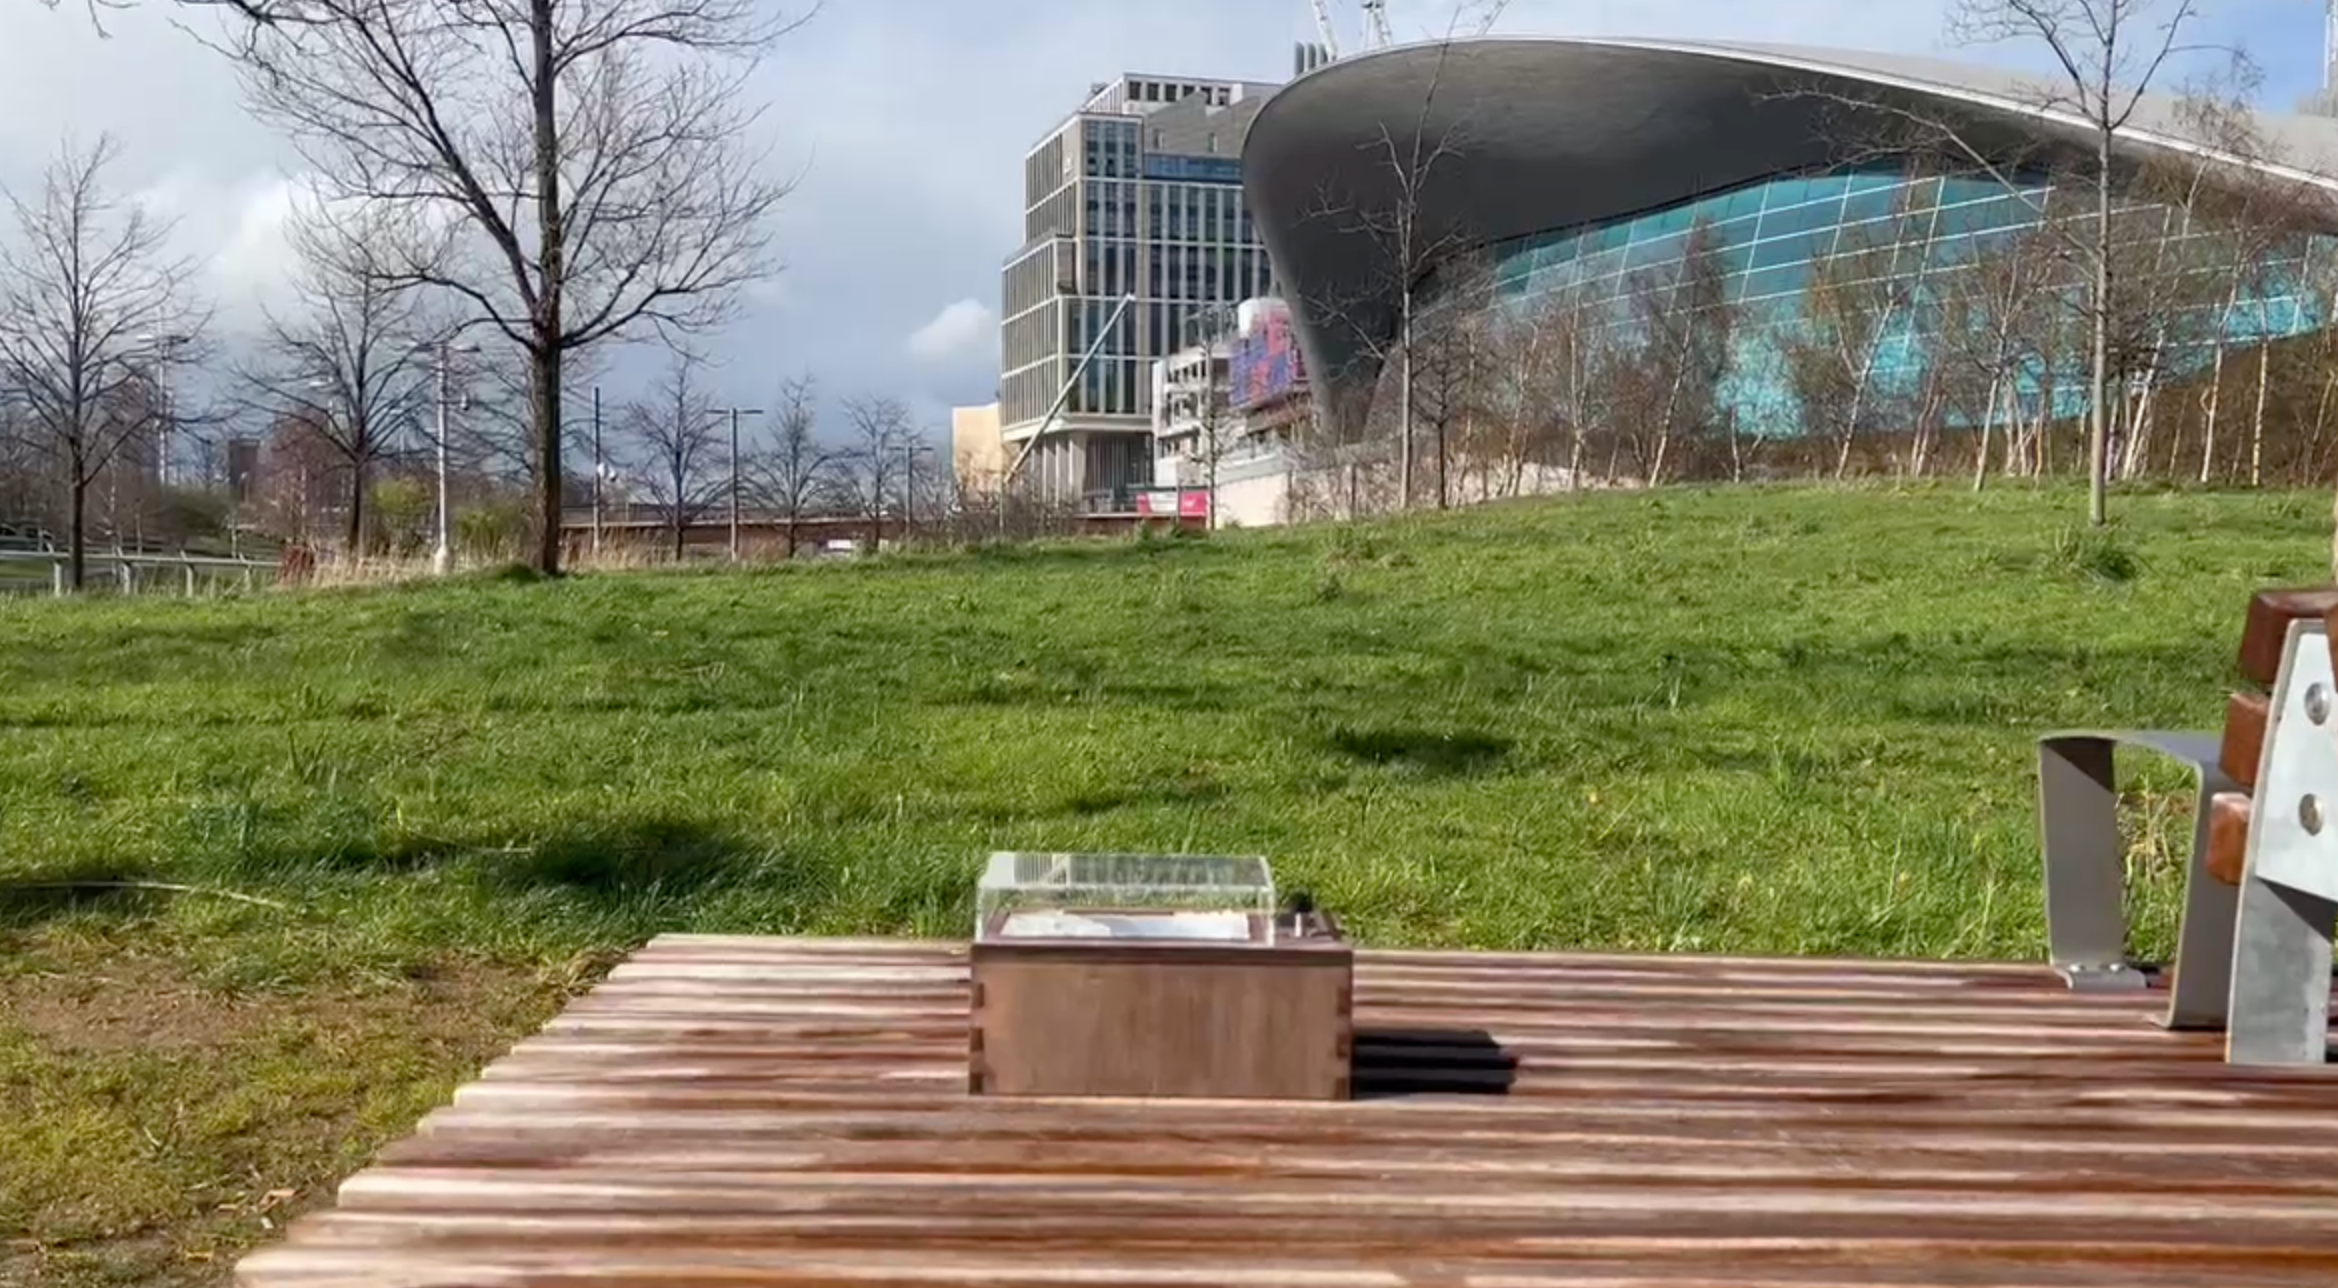
The QEOP Data Dashboard Device is a real-time, aesthetically pleasing data dashboard designed to provide users with comprehensive information about the Queen Elizabeth Olympic Park (QEOP) and its surrounding environment. The device combines the functionality of a data dashboard with the visual appeal of an objet d'art, making it accessible and engaging for general users.
- Real-time data visualisation
- Intuitive user experience with geographical context
- High-quality, visually appealing design
- Customisable map layers
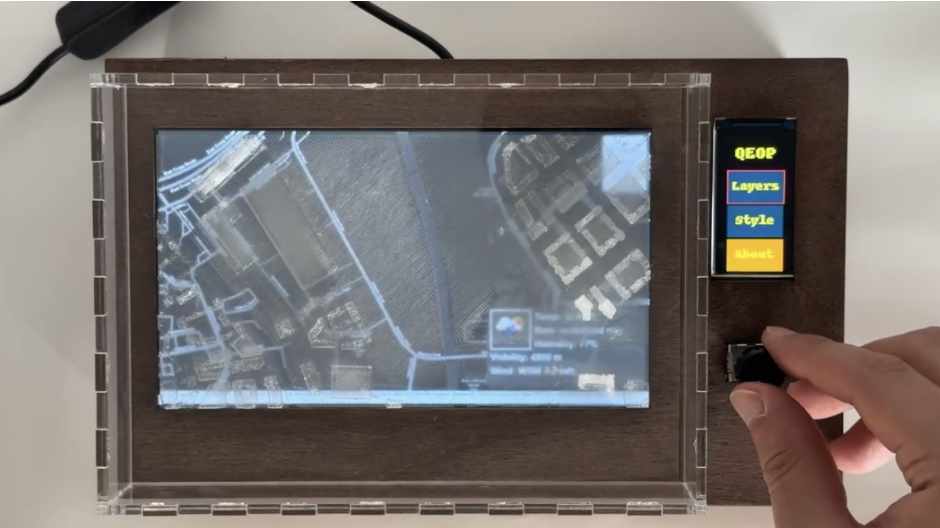
- Interactive map with weather, network coverage, 3D buildings, and more
- Clone the repository.
git clone https://github.com/CE-GPP/miniature-park.git
- Run the device control application.
cd device/controls
python main.py
- Navigate to the project directory.
cd ../../
cd map/weatherleaflet
- Install the required dependencies.
npm install
- Run the backend application.
node app.js
- Run the frontend application.
cd demo
npx live-server
- JavaScript
- Leaflet
- Node.js
- Express.js
- Socket.io
- MQTT.js
- Python
- Adafruit GFX Library
- Adafruit-ST7735-Library
- Raspberry Pi 4 Model B
- Elecrow RC070LCD Display with Touch Screen
- Adafruit 1.9" 320x170 Color IPS TFT Display
- EC11 Rotary Encoder Module
Bill of Materials : https://github.com/CE-GPP/miniature-park/blob/main/report/src/Sketch_bom.png
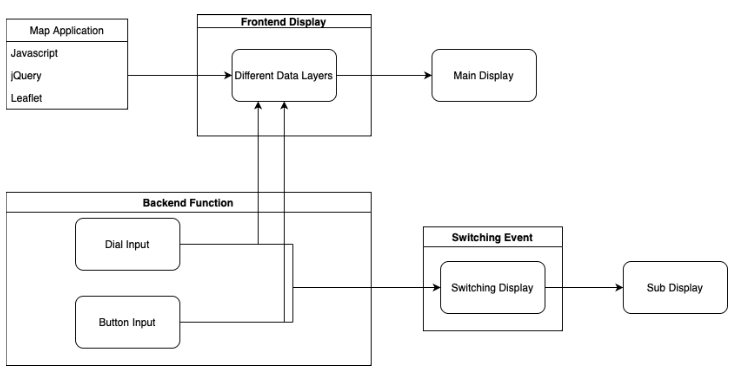
device/controls: Contains code for the sub-display and the rotary encoder.device/device model: Contains 3d model of enclosure.device/fabrication: Contains drawings of the enclosure for fabrication.device/map: Contains 3d model of QEOP map for the 3d printing.map/weatherleaflet: Contains map application including the frontend and backend.
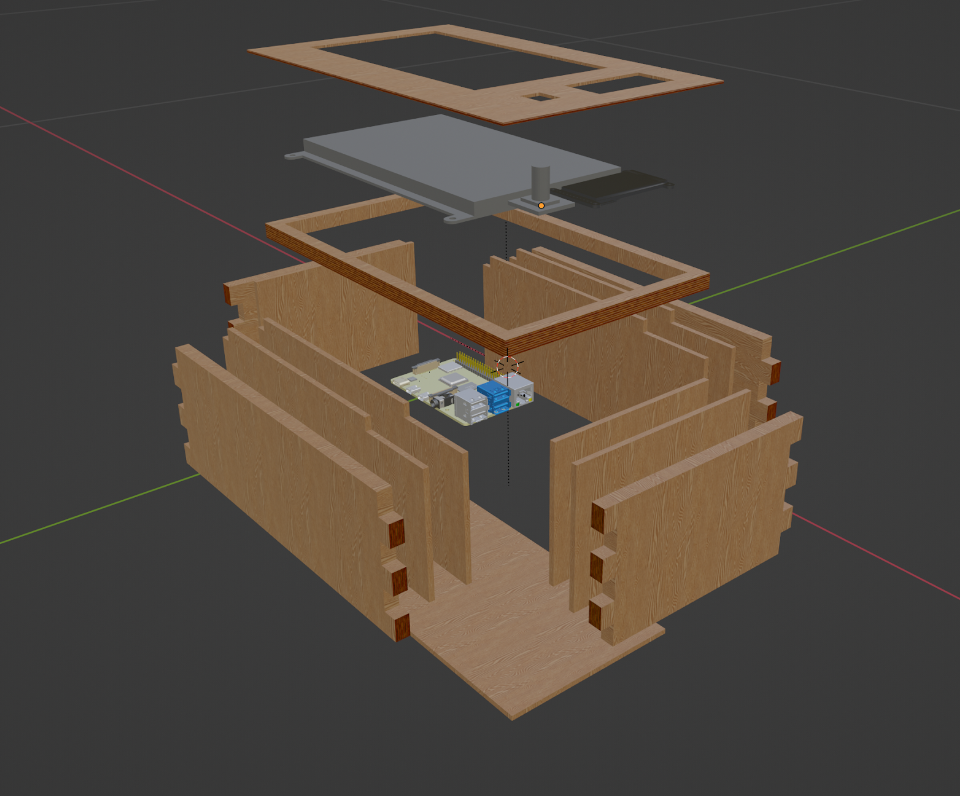
- Design and development of a transparent 3D printed model in Blender.
- Creation of a wooden enclosure using laser cutting and wood stain to achieve a classic oak appearance.
- Integration of a 7-inch main display with HDMI support, a 1.9-inch sub-display with a custom UI for a dynamic data feed, and an EC11 rotary encoder for easy control.
- Utilisation of a Raspberry Pi 4 for computing and displaying data, allowing for quick software development using Python and web-based frameworks.
We welcome contributions from the community. If you'd like to contribute to the QEOP Data Dashboard Device, please follow these steps:
- Fork the repository
- Create a new branch with a descriptive name, e.g., feature/new-map-layer
- Commit your changes to the new branch
- Submit a pull request to the main repository
Please make sure your code follows the existing style guidelines and provide a detailed description of your changes in the pull request.