A python project for various probability-related explorations. Work with, sample, visualize, combine, compare all your favorite random variables, play poker, or take a random walk on the numberline.
- Bernoulli
- Binomial
- Geometric
- Hyper geometric
- Poisson
- Uniform
- Exponential
- Normal
- Erlang
- Basic Functions
- Expected value
- CDF
- Generic and recursive
- Tail
- Variance
- Higher Moments [work in progress]
- Via MGF, Laplace/z-Transform, or directly, depending on the distribution
- Simulation
- Generate a random instance of a given distribution
- Generic and recursive inverse transform method
- Continuous accept/reject method
- k rounds of generating independent instances of a given distribution
- k independent rounds, j times
- Compare sums of one distribution to other distributions
- e.g: Erlang distribution as sum of exponentials
- Binomials as sums of Bernoullis, etc.
- Generate a random instance of a given distribution
- Visualization
- Plotting
- plot and compare any numerical function of the
RandomVariableclass with other distributions and/or other conditions of the same distribution - compare sampled data to the true distribution graphically
- plot the pdf,cdf,tail etc.
- visualize the max of binomials across k trials
- plot and compare any numerical function of the
- Plotting
- Random Walks [work in progress]
- Visualize 1D random walks, and some properties of them [not completely committed yet (
plot.py)]
- Visualize 1D random walks, and some properties of them [not completely committed yet (
- Poker [work in progress]
- Play a random poker hand
- Play k random poker hands, and obtain a bar chart of the probabilities of obtaining each outcome
- See the
pokerdirectory for another README
X = Geometric(0.3)
print(X.pdf(5))
> 0.072029-
- setting
verboseto true will print the intermediate derivatives, using the Laplace transform in the case of the Exponential distribution
- setting
X = Exponential(.1)
print(X.moment(4,verbose=True)) # should be 4!/(.1^4) = 240000
> 0.1/(x + 0.1)
> -0.1/(x + 0.1)**2
> 0.2/(x + 0.1)**3
> -0.6/(x + 0.1)**4
> 240000.000000000X = Binomial(100,.5)
print(u.chebyshevs(X,25)) # P[|X - E[X]| >= 25]
> 0.04P = Plot()
P.plot({'binomial':([(20,.3),(20,.5),(20,.7)],20,1)},'pdf')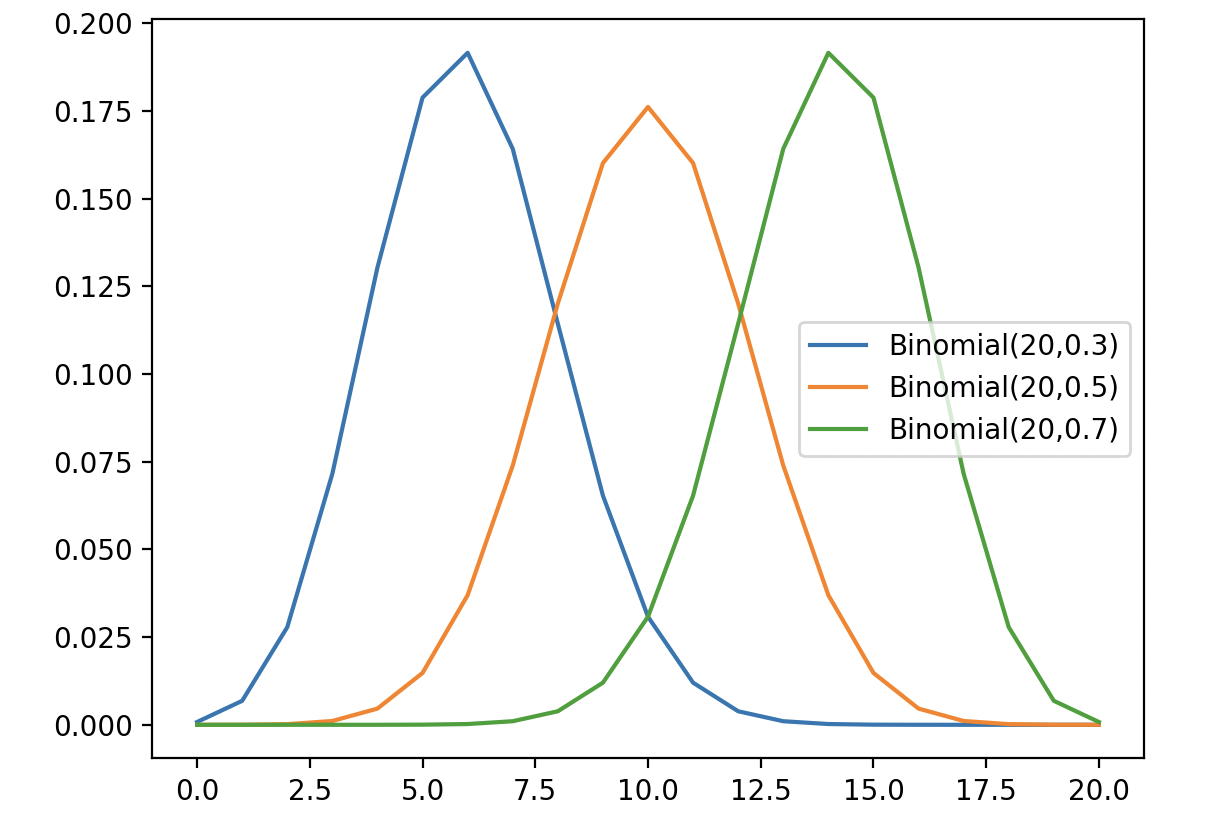
X = Normal(-10,10)
print(X.genVar())
> -12.483660083014579util = Util()
util.simAll(k=10000)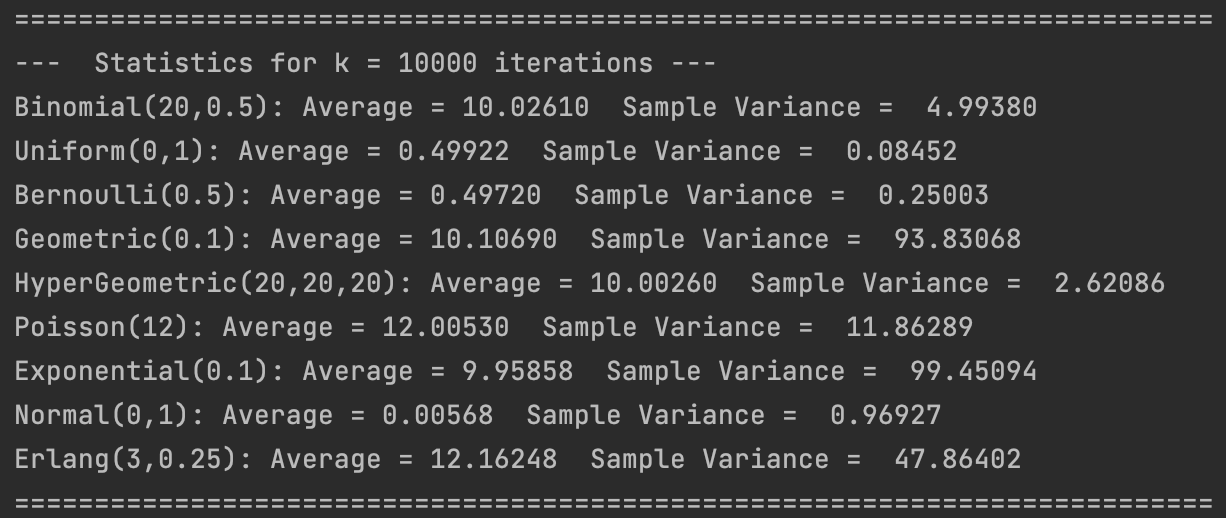
P = Plot()
P.plotSamples(Poisson(10),10000)
- Visualize simple bounded 1D random walks
rw = NumberLineRW()
rw.graphWalks(100,50)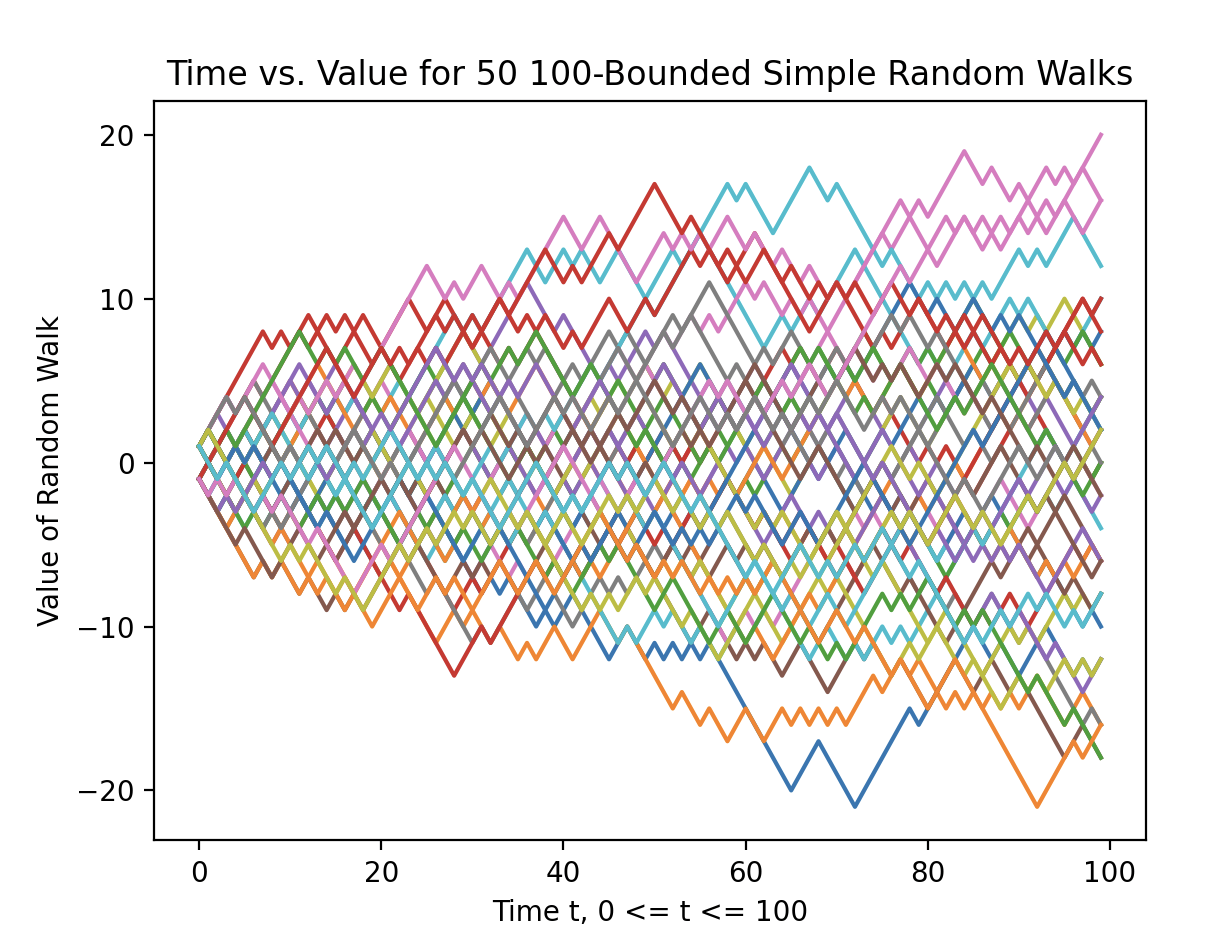
rw = IntegerLatticeRW()
rw.graphWalks2D(100,50)
- You can vary
pas well:
rw = IntegerLatticeRW(.7)
rw.graphWalks2D(100,50)