-
Goal: Using two
IMU sensors(in red) placed on the spine to monitor the spinal motion and curvature.
-
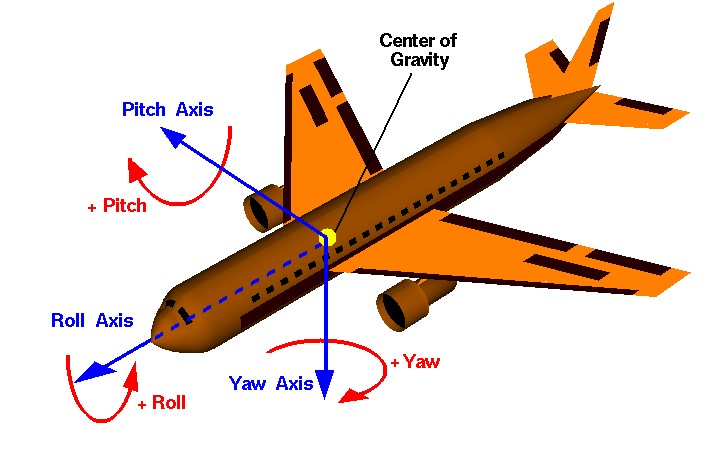
We've done some previous work to have the IMU sensors measure the rotational angles on the
x,y,zaxis. The angles of rotation are called roll, pitch, yaw, respectfully.

-
What it is: Parametric Curves defined by a set of control points
-
How the curves are drawn:
-
3 control points in 2D:
-
4 control points in 2D:
-
-
Mathematical Definition:
-
The general formula of Bézier curve $ \mathbf{B}(t) $ is given by:
$$ \mathbf{B}(t) = \sum_{i=0}^{n} \binom{n}{i} (1 - t)^{n-i} t^i \mathbf{P}_i $$ where t describes the position of the points along the curve, range from 0 to 1.
-
The formula can be expanded as:
$$ \mathbf{B}(t) = (1 - t)^n \mathbf{P}_0 + \binom{n}{1} (1 - t)^{n-1} t \mathbf{P}_1 + \cdots + \binom{n}{n-1} (1 - t) t^{n-1} \mathbf{P}_{n-1} + t^n \mathbf{P}_n, \quad 0 \leq t \leq 1 $$ -
The derivative: $$ \mathbf{B}'(t) = n \sum_{i=0}^{n-1} b_{i,n-1}(t) (\mathbf{P}_{i+1} - \mathbf{P}_i), \quad 0 \leq t \leq 1 $$
-
-
We aim to simulate the curvature of the spine based on IMU readings.
Uncertainty 1: I thought that we would have enough information to draw a 4-point Bezier curve yet this might not be true. If this turns out to be causing the issue, I would gladly turn the order of the curve to 3-points. -
For simplification, we treat the selected spine segment as a curved path defined by four control points:
A,B,C, andD, with IMUs placed at positions corresponding to 20% and 80% along the path.t1 = 0.2, t2 = 0.8
-
We define the start and end points of the path,
AandD, which gives us two points to start with. Then, we work backwards using properties derived from the IMU readings to determine the coordinates of the intermediate control pointsBandC. -
To summerize the given and unknowns:
- Given:
- The IMU readings
roll, pitch, yawat two positions along the curve. - The distances or relative positions of the IMUs (20% and 80% along the curve).
- The coordinates of the start and end points,
AandD.- (the coordinates can be anything, I just happened to be picking
(0, 2.5, 0)and(0, -2.5,0)for simplicity of graphing, we can change this)
- (the coordinates can be anything, I just happened to be picking
- The IMU readings
- To find: The coordinates of the intermediate control points
BandC.
- Given:

-
For a 4-point Bezier Curve with points, $ \mathbf n=4 $, the equation with respect to the four points
A,B,C,Dis given by:$$ \mathbf{B}(t) = (1-t)^3\mathbf{A}+3(1-t)^2t\mathbf{B}+3(1-t)t^2\mathbf{C}+t^3\mathbf{D},\ 0 \le t \le 1 $$
with derivative:
$$ \frac{d\mathbf{B}}{dt} = -3(1 - t)^2 \mathbf{A} + 3(1 - t)(1 - 3t) \mathbf{B} + 3t(2 - 3t) \mathbf{C} + 3t^2 \mathbf{D} \ \ \ \ \ \ \ \ \ \ \ \ \ \ \ \ \ \ \ \ (*) $$
-
Here,
AandDare known. -
If we are able to get $ \frac{d\mathbf{B}}{dt} $ at $ \mathbf t=0.2, t=0.8 $ through the row, pitch, yaw angles provided by the two IMUs, then the only unknows we are left with will be
B, andC. -
We should then be able to solve the problem by solving the two quadratic equations at $ \mathbf t=0.2, t=0.8 $
Uncertainty 2: The assumption made in here was that the row, pitch, yaw angles we got from the IMU sensors will give us enough information to construct dB/dt, yet this might be false.
-
Construct a rotational matrix from the elementry rotation on each idividual axis

-
Multiple the rotation matrix with a basis vector: $$ \mathbf{v}_{\text{rotated}} = R \cdot \mathbf{v},\ \
v = \begin{bmatrix} 1 \ 0 \ 0 \end{bmatrix} $$` -
I then used
Uncertainty 3: I'm aware that this step may be wrong but I don't know how to fix it: the roll, pitch, yaw angles gives only the direction of the gradient vector but not the magnitude. I tried normalizing the gradient vector got from this step and use it as dB/dt, but it did't work out and made no logical sense.$\mathbf{v}_{\text{rotated}}$ as the gradient vector$\frac {d\mathbf{B}}{dt}$

-
pluged in $ t = 0.2 $ and $ t=0.8 $ into equation
$(*)$ 
-
Solved B and C using matrices:


-
right now, when I test my code by setting the roll, pitch, yaw angles as shown in the picture:

the gradient vector
$\frac {d\mathbf{B}}{dt}$ I got for t = 0.2 and 0.8 are:
the final answer calculated for vector
BandCare:
- This answer is way off, because given the start point and end point, the y-axis value for
BandCshould be within [-2.5, 2.5].
- This answer is way off, because given the start point and end point, the y-axis value for


