An interactive, web-based predictive analytics tool for visualizing time-series data and forecasting future trends using a variety of statistical models. This project is built with vanilla JavaScript and is fully self-contained in a single HTML file.
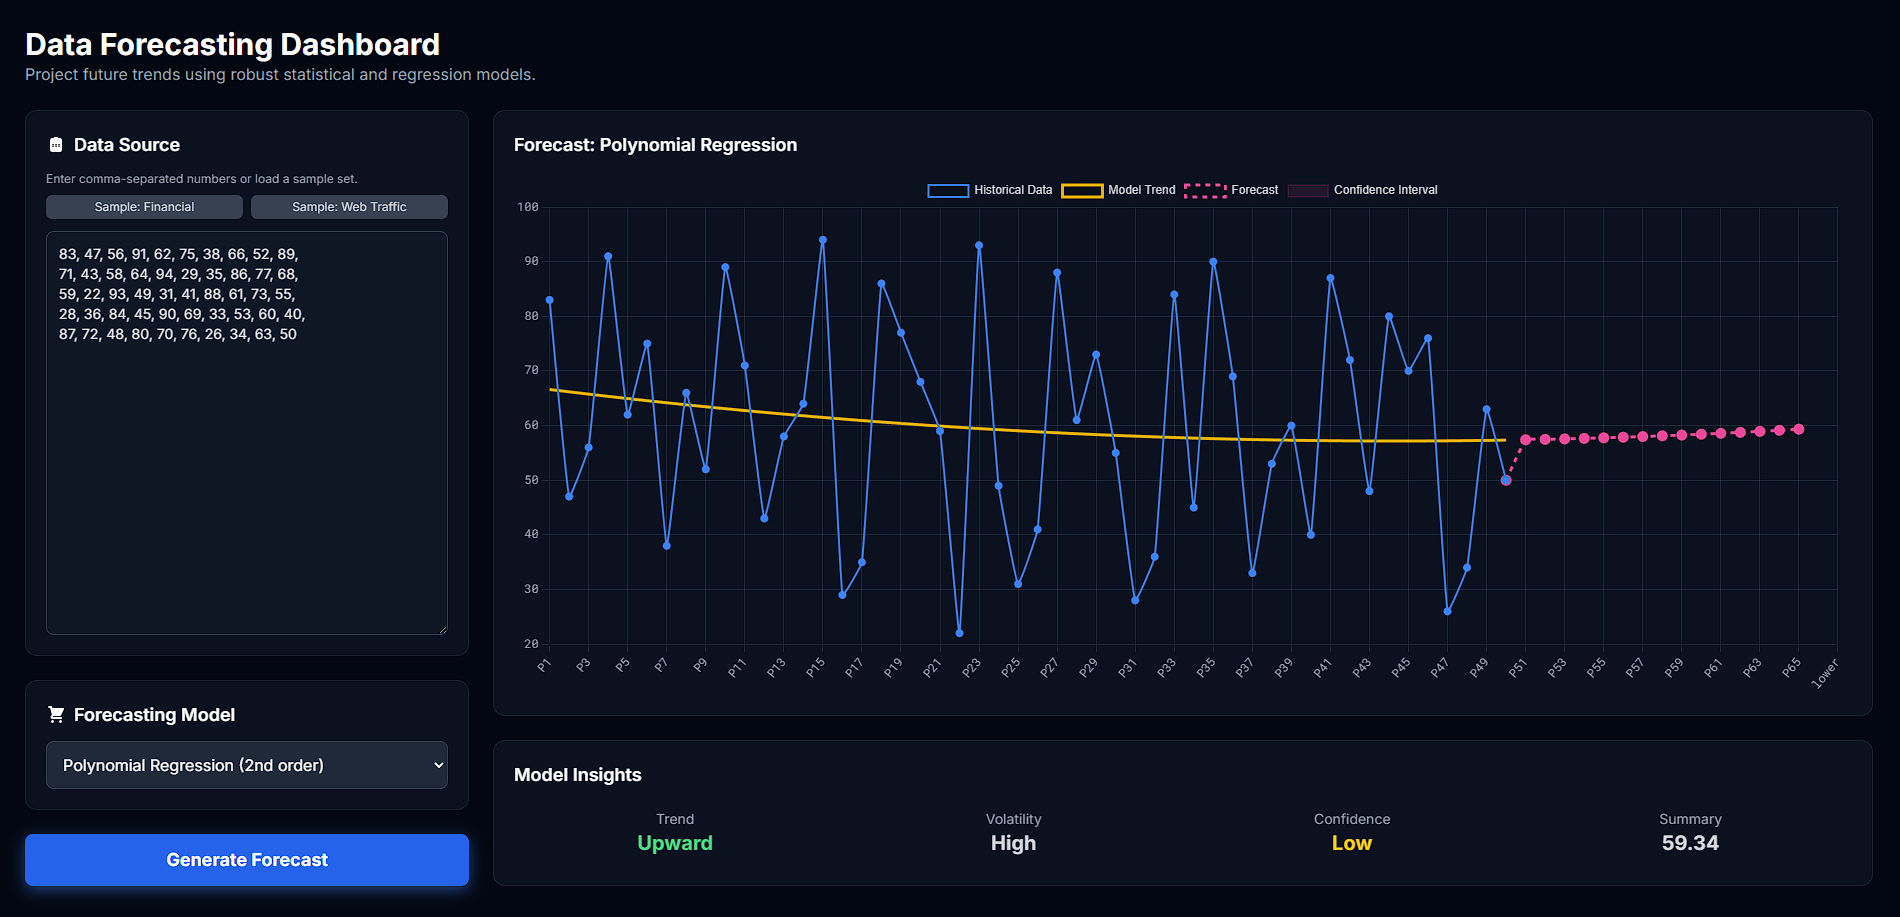
- Multiple Forecasting Models: Choose from four distinct statistical and regression models to best fit your data.
- Interactive & Beautiful Charts: Visualizes historical data, model trendlines, and future forecasts in a clean, responsive chart powered by Chart.js.
- Confidence Intervals: Displays a shaded confidence interval to represent the range of likely future outcomes, providing a more nuanced prediction.
- Automated Model Insights: Automatically generates a qualitative analysis of the forecast, assessing trend direction, data volatility, and model confidence.
- Custom & Sample Data: Users can paste their own comma-separated time-series data or load one of the built-in sample datasets to get started immediately.
- Modern UI/UX: A sleek, dark-themed "glass panel" interface built with Tailwind CSS for a professional look and feel.
- Zero Dependencies: The entire application runs in the browser from a single HTML file with no need for a backend or installation.
- Open index.html in any modern web browser or visit the Live Demo
- Load Data:
- Click "Sample: Financial" or "Sample: Web Traffic" to load a pre-configured dataset.
- Alternatively, paste your own comma-separated numerical data into the text area.
- Select a Model: Choose a forecasting model from the dropdown menu.
- Generate Forecast: Click the "Generate Forecast" button to run the analysis and display the results.
- Linear Regression: Fits a straight line to the historical data to predict future values. Best for data with a simple, consistent linear trend.
- Polynomial Regression (2nd Order): Fits a curved line (a parabola) to the data. Excellent for capturing non-linear trends and turning points.
- Moving Average (5-Period): Smooths out short-term fluctuations to identify the longer-term trend. The forecast is based on the average of the last several data points.
- Double Exponential Smoothing (Holt): A sophisticated forecasting method that excels at modeling data with a clear trend, giving more weight to recent data points.
- HTML5
- CSS3 & Tailwind CSS for styling and layout.
- Vanilla JavaScript for all application logic and DOM manipulation.
- Chart.js for creating beautiful and interactive charts.
- simple-statistics for foundational statistical calculations like linear regression and standard deviation.