



Geospatial and time-series analysis of 911 calls and police-reported crime data across Nashville — identifying hotspots, shift patterns, and ZIP-level growth trends to support smarter public safety planning.
| Data Sources | Metro Nashville Police Department + HubNashville Open Data |
| Period | 2018 – 2021 |
| Records | 1M+ rows across 4 datasets |
| Analysis Types | Geospatial mapping, time-series, crime confirmation, ZIP growth trends |
| Tools | Python, Pandas, Folium, GeoPandas, Power BI, PostgreSQL, Docker |
| Dataset | Description | Source |
|---|---|---|
| MNPD Crime Incidents (2018–2021) | Crime type, time, and ZIP code | Metro Nashville Open Data |
| 911 Calls for Service (2018–2021) | Citizen-reported safety and service calls | HubNashville |
| Fines and Violations | Public sanitation fines and collection outcomes | HubNashville |
| Geospatial Boundaries | ZIP code and precinct shapefiles | MNPD Open Data |
| Question | Insight Delivered |
|---|---|
| What are the most frequent incident types by ZIP code? | Resource allocation by neighborhood |
| How do 911 calls correlate with confirmed crimes? | Identify high-confirmation call types |
| What times of day show the highest activity? | Optimize shift scheduling |
| Which ZIP codes show the most growth? | Anticipate suburban safety demand |
| How have call volumes shifted over 4 years? | Longitudinal trend analysis |
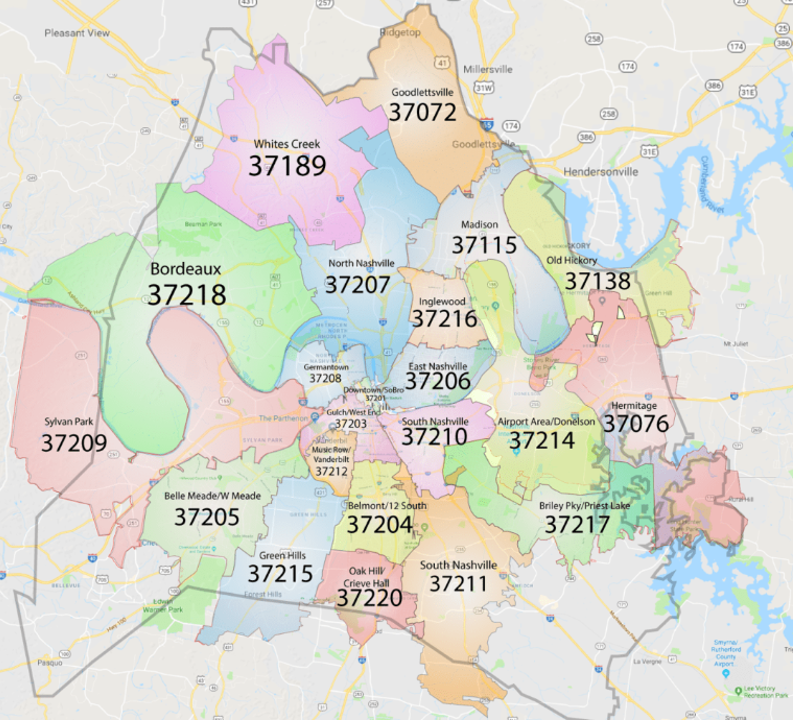
Geographic context for public safety analysis — spatial patterns across Nashville neighborhoods.
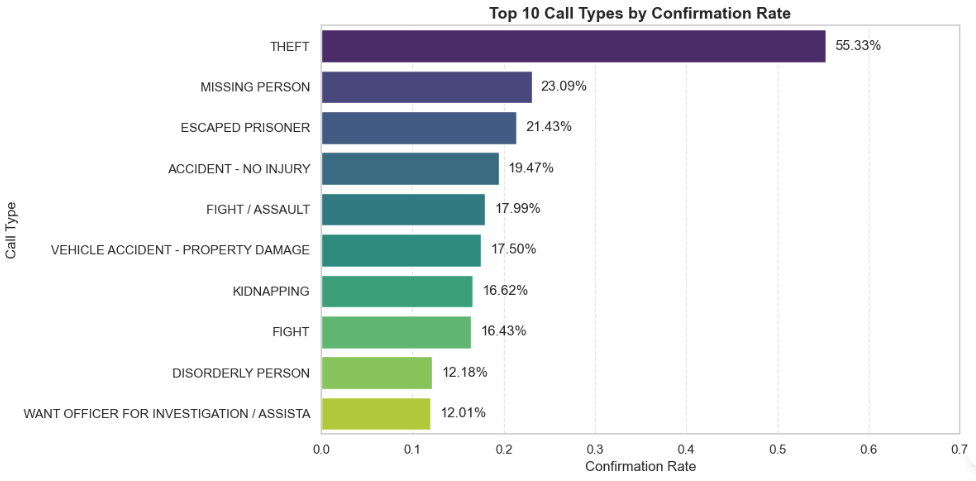
Theft has the highest confirmation rate at 55.3%, followed by Missing Person (23.1%) and Escaped Prisoner (21.4%) — representing the most resource-intensive response categories.
| Period | Finding | Key ZIPs |
|---|---|---|
| 2019 vs 2018 | 37135 (Nolensville) highest growth rate (+2.0) — strong suburban development | 37135, 37203, 37209 |
| 2020 vs 2019 | 37086 and 37143 showed 100%+ increase — population shifts and local events | 37086, 37143, 37232 |
| 2021 vs 2020 | Continued high growth in fast-developing suburban and business zones | 37208, 37210, 37207 |
| Shift | Hours | Pattern |
|---|---|---|
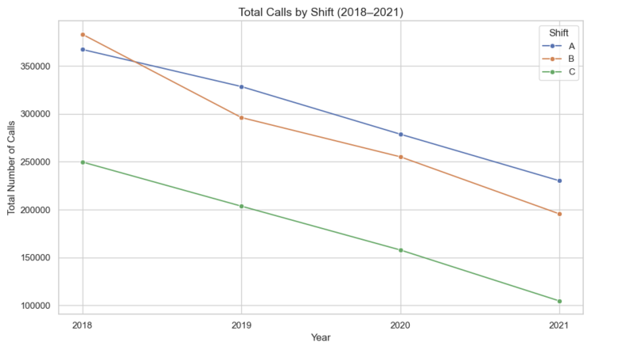
| Shift A | 6 AM – 2 PM | Highest volume, especially Spring — most staffing demand |
| Shift B | 2 PM – 10 PM | Steady decline after 2019 |
| Shift C | 10 PM – 6 AM | Lowest volume, mirrors general trends |

Downtown, East Nashville, and South Nashville show the highest incident density. Business corridors drive strong demand for patrol and security response.
| Finding | Recommended Action |
|---|---|
| Morning shifts peak in volume | Increase staffing 6 AM–2 PM, especially Spring |
| High-growth suburban ZIPs | Prioritize 37135 and 37208 for expanded coverage |
| High-confirmation crime types | Reallocate resources toward Theft and Missing Person calls |
| Low-confirmation call types | Review and refine to reduce unnecessary response burden |
Nashville-Public-Safety/
├── data/
│   ├── raw/                    # Original datasets
│   └── cleaned/                # Processed data files
├── notebooks/
│   └── analysis.ipynb          # Main analysis notebook
├── visuals/
│   ├── nashville_zip_map.png
│   ├── call_types_confirmation.png
│   ├── zip_growth_trend.png
│   └── heatmap_nashville.png
├── dashboard/                  # Power BI report file
└── README.md
- Expand to 2022–2024 data for post-COVID trend analysis
- Build interactive Streamlit dashboard for real-time ZIP filtering
- Add predictive model for call volume forecasting by shift and season
- Integrate Census demographic data for socioeconomic context
Jing You — Data Analytics & Engineering


Capstone Project · Nashville Software School · Data: Metro Nashville Open Data Portal 2018–2021