An end-to-end data project analyzing air quality across 9 major Indian metro cities using Python and Tableau.
aqi-dashboard/
│
├── data/
│   ├── city_day.csv          # Raw dataset (source: Kaggle)
│   └── aqi_metro.csv         # Cleaned dataset used in Tableau
│
├── scripts/
│   └── prepare_data.py       # Data cleaning script
│
└── README.md
| Tool | Purpose |
|---|---|
| Python (Pandas) | Data cleaning & preparation |
| Tableau Public | Dashboard & visualizations |
- Dataset: Air Quality Data in India (2015–2020)
- Source: Kaggle
- Raw rows: ~19,800 across 26 cities
- After cleaning: ~9,400 rows across 9 metro cities
- Filtered to 9 major metro cities: Delhi, Mumbai, Chennai, Kolkata, Bengaluru, Hyderabad, Ahmedabad, Jaipur, Gurugram
- Dropped niche pollutant columns: NO, NOx, NH3, Benzene, Toluene, Xylene
- Removed all rows with null values
- Final columns retained:
City, Date, PM2.5, PM10, NO2, CO, SO2, O3, AQI, AQI_Bucket
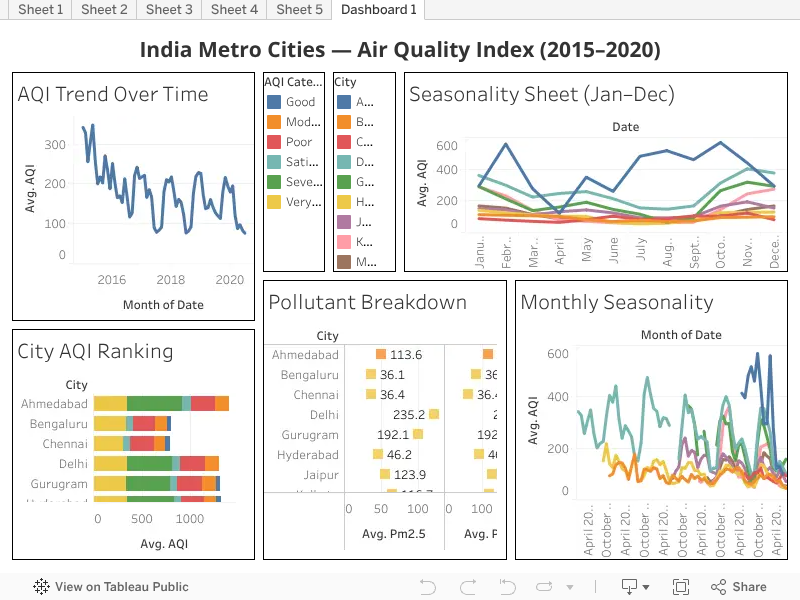
| Sheet | Chart Type | Insight |
|---|---|---|
| AQI Trend Over Time | Line Chart | Overall AQI decline + COVID-19 lockdown dip (2020) |
| City AQI Ranking | Horizontal Bar | Delhi consistently worst; Bengaluru & Chennai cleanest |
| Pollutant Breakdown | Bar Chart | PM2.5 & PM10 are dominant pollutants in northern cities |
| City AQI Trends | Multi-line Chart | Per-city AQI trends across 5 years |
| Monthly Seasonality | Line Chart | Winter (Oct–Jan) spikes and monsoon (Jun–Aug) dips |
- Delhi has the highest average AQI across all years and all pollutants
- COVID-19 lockdown (March–May 2020) caused a visible and significant AQI drop across all cities
- Winter months (November–January) see the worst air quality due to crop burning and cold air trapping pollutants
- Monsoon season (June–August) brings the cleanest air across all cities
- Southern cities (Bengaluru, Chennai, Hyderabad) maintain significantly better air quality year-round
# Install dependencies
pip install pandas

# Place city_day.csv in the data/ folder
# Then run:
python scripts/prepare_data.py
The cleaned aqi_metro.csv will be saved to the data/ folder, ready to load into Tableau.
- Name: Pranav M S Krishnan
- Github: Pranav-MSK
- Tableau Public: Visit my Profile