
Author Rohan Dawar
A Voronoi Diagram is a plane consisting of points and polygons.
The polygons, or Voronoi Cells surrounding each point represent the area closer to that point than another point on the plane.
Essentially, all area within a polygon X is more proximal in Eucliadian distance to point X than to any other point.
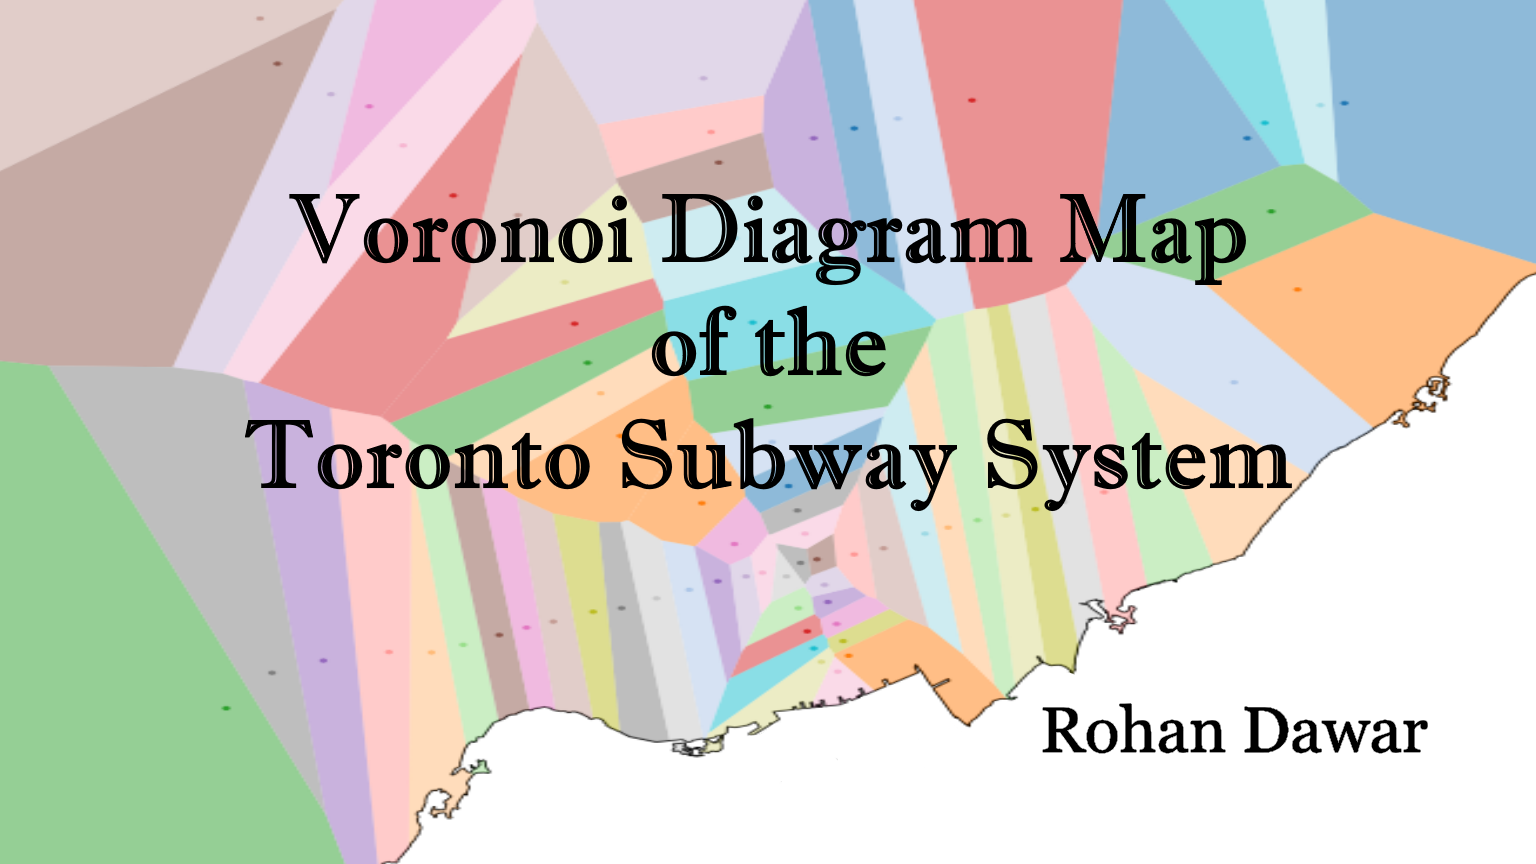
In this project I have created a voronoi map, both in Geopandas and Folium, of the Toronto Subway System, with points corresponding to subway stations.
The resulting map shows us which subway station is closest to any area in the city, and can be used for further analysis!
The software and output models in this project are licensed under the MIT License - see the LICENSE.md file for details