This file should give a brief description of the directory space I am using, what each file is used for and how to exectute each in the command line. all datasets are obtained from 'www.cxro.lbl.gov'
Main directory folder is titled: simpleMC subfolder within main directory folder is titled: FunctionFromTable
Main directory "simpleMC" contains:
simpleMC.cc:
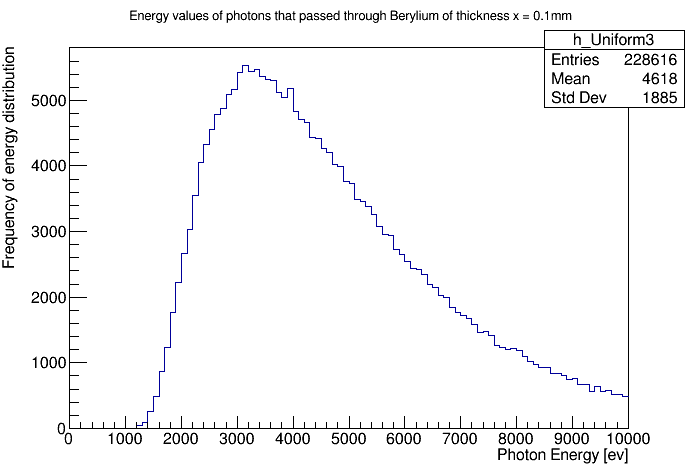
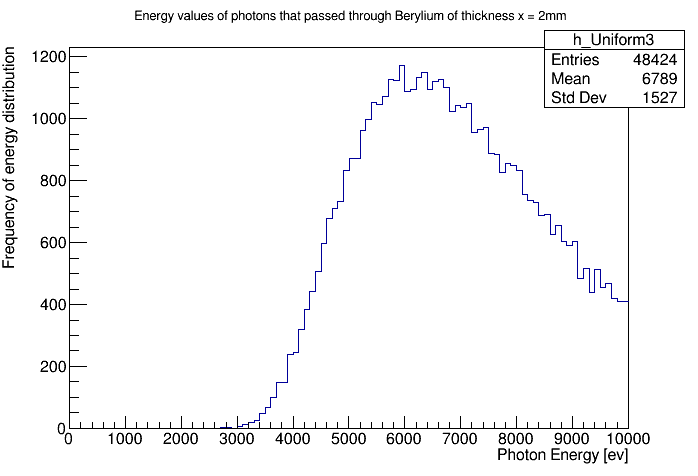
- simpleMC.cc is the core program in this project that I worked on. This program contains the source code for the software implementation. This implementation includes; simulating the xray photons from synchotron radiation and the interaction of these xray photons with a material which was Berylium in this case.
- To execute type 'gmake' in command line to compile simpleMC.cc file (runs the GNUmakefile discussed below which includes simpleMC.cc)
- Then type './simpleMC' in command line to execute simpleMC exe file
plotUniform.C
- Simple ROOT macro to plot a histogram.
- To execute, type .X plotUniform.C
- This specific histogram was used in conjuction with simpleMC.cc to output a histogram for the uniform distrubtion of a random number.
plotUniform1.C
- Simple ROOT macro to plot a histogram.
- To execute, type .X plotUniform.C
- This specific histogram was used in conjuction with simpleMC.cc to output a histogram for changing a flat energy values histogram to a curve.
plotUniform2.C
- Simple ROOT macro to plot a histogram.
- To execute, type .X plotUniform.C -plotter.py
GNUmakefile
- This is a simple makefile to build programs that require the ROOT
- Type gmake in command line to build the program; use gmake test to look e.g. at values of defined variables; use gmake clean to remove executable and object files.
build.sh
- This is just a build script.
plotter.py
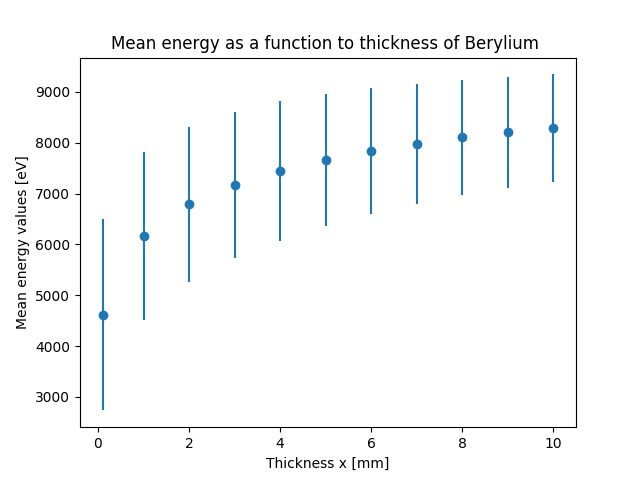
- python source code to use matplotlib to plot a basic thickness vs mean energy values scatter plot with error bars, using manually inputed values that arise from the histograms generated from simpleMC.cc.
- execute with 'python3 plotter.py' in command line
thicknessVsMeanEnergyPlot.png
- output file from source code of plotter.py. Image shows a histogram of thickness vs mean energy values
Sub folder "simpleMC/FunctionFromTable" contains:
builds.sh
- just a build script -data.txt
- important dataset covering part 1 of the project (stimulation of xray photons from synchrotron radiation)
- Contains 2 columns:
- Column 1 was the energy values in ev from 10 ev to 10^4 ev.
- Column 2 was the frequency in photons per second
lengthData.txt
- important dataset covering part 2 of the project (Interaction of x-rays with matter)
- column 1 was the energy values in ev from 30ev to 10^4 ev
- column 2 was the attenuation length in microns(10^-6 of a metre) of Berylium at an angle of 90degrees.
FunctionFromTable.cc
- source code for functionFromTable class to create a function from a table of (x,y) values.
FunctionFromTable.h
- header file for FunctionFromTable class include in the FunctionFromTable.cc.
plotComparison.py
- basic python file using matploiblib and numpy to read data from the data.txt file and output a graph based on its data.
- execute with 'python3 plotComparison.py' in command line
pythonPlot.png
- output file of plotcomparison.py which generates a png showing energy vs frequency from data.txt dataset.