Visualizing large sample data to interactive charts/graphs Dashboard app with React Apex Chart Library
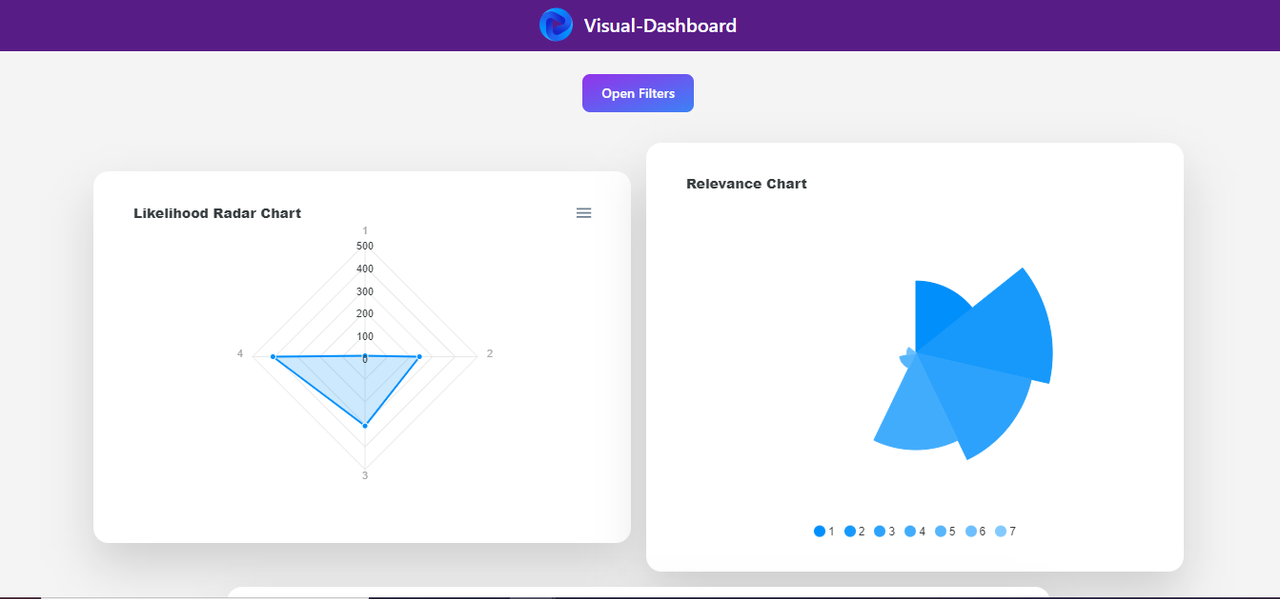
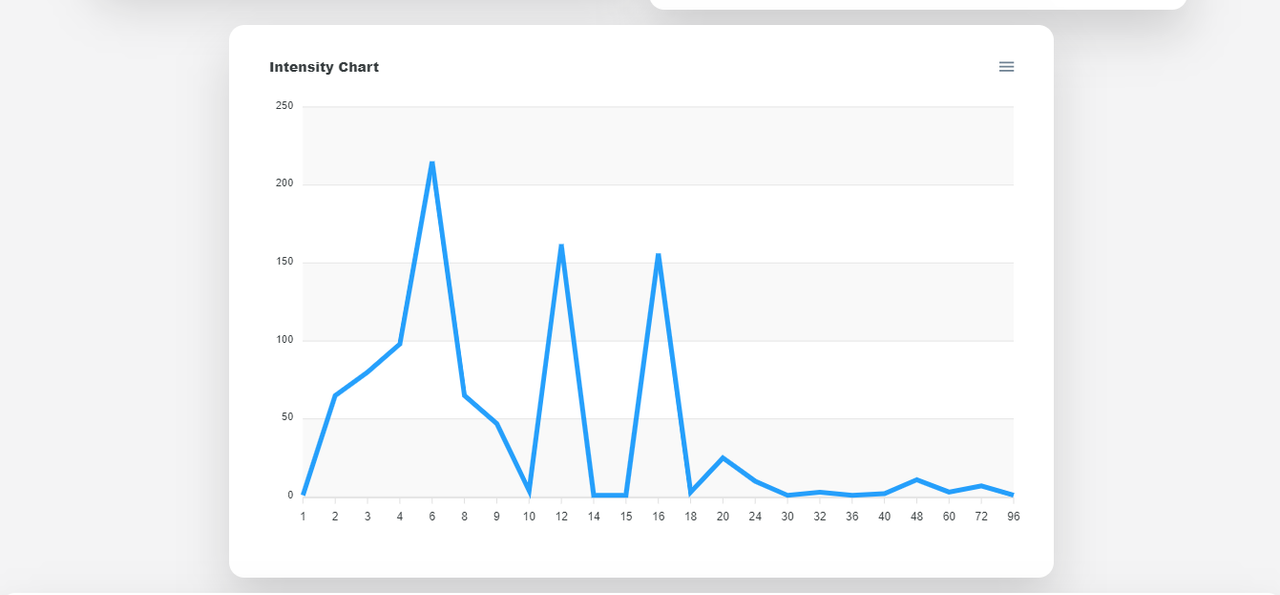
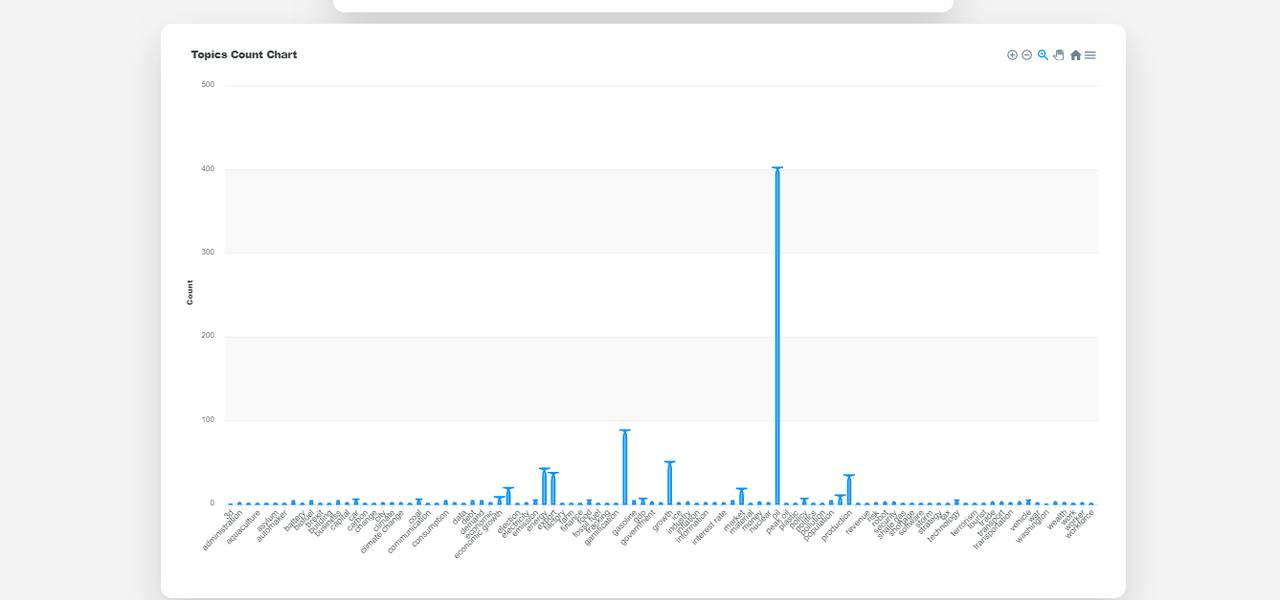
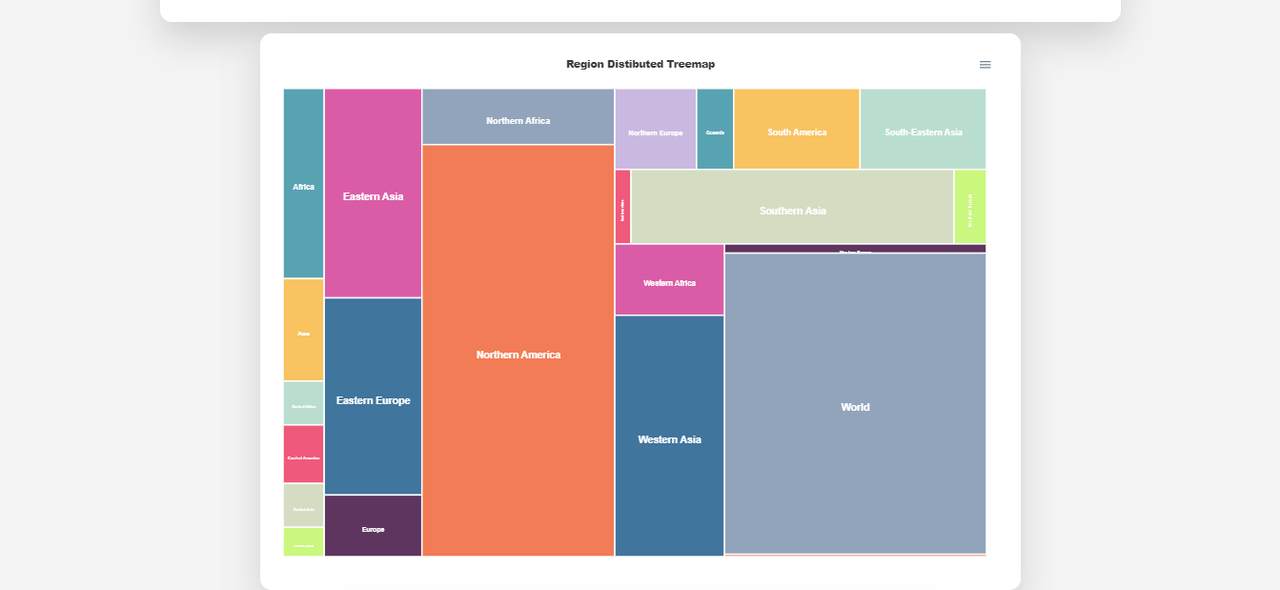
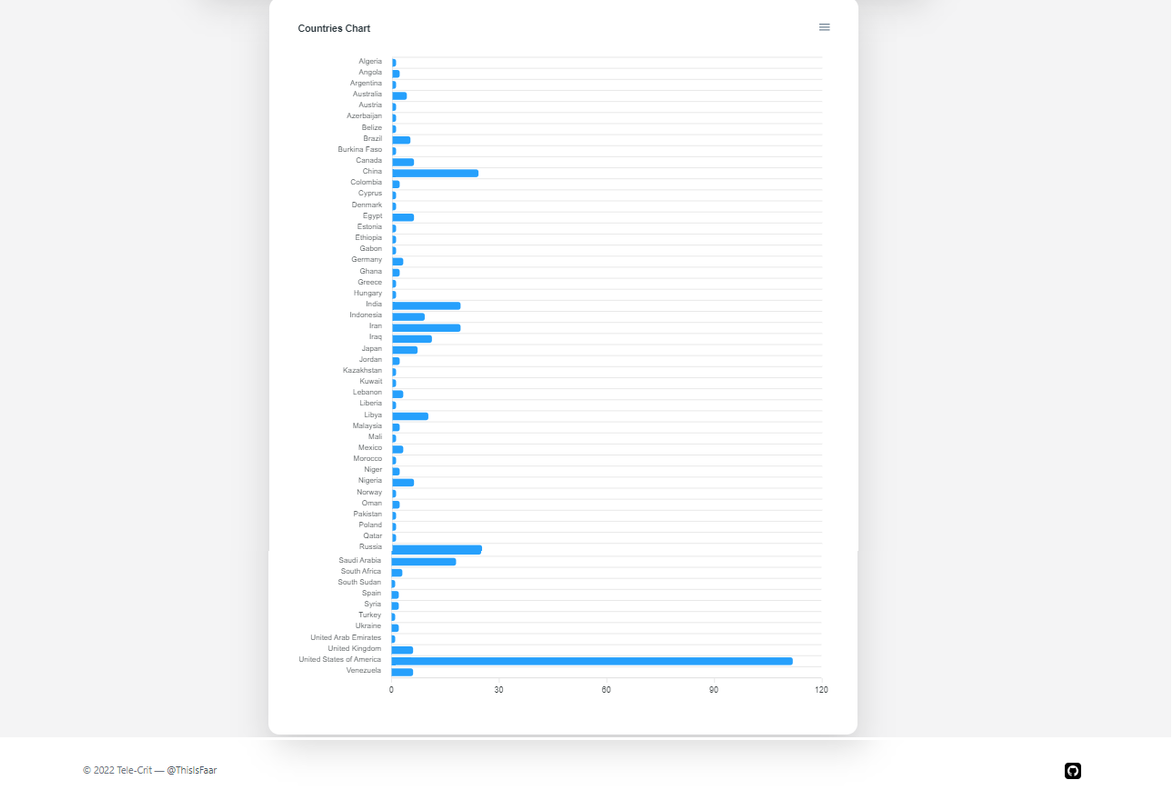
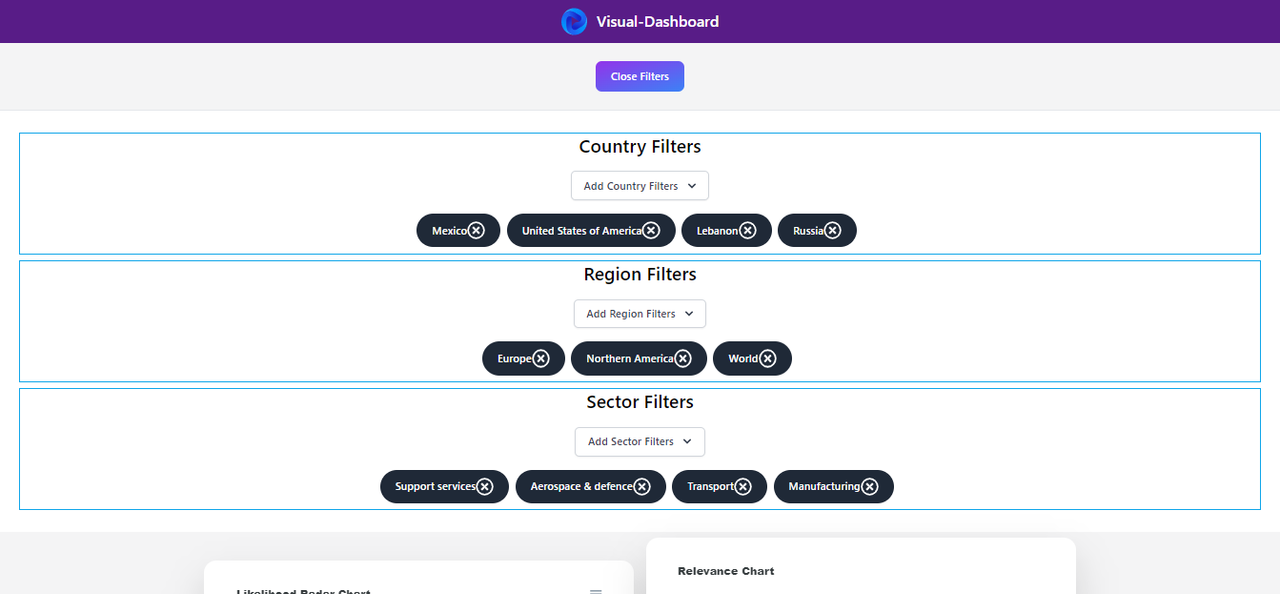
- Charts rendered with ReactApexChart Library
- 6 Charts + 5 filter Variables
- Single Page Application built over ReactJS
- NodeJS RunTime ENV.
- REST API with ExpressJS
- NoSql DataBase used (MongoDB)
- UI Design/CSS Frameworks: TailwindCSS
To run this project, you will need to add the following environment variables to your .env file
PORT Backend App Port (custom port if needed, by default 5000)
MongoURI MongoURI
REACT_APP_API_URL API Link of Backend
Install project with npm
  git clone https://github.com/ThisIsFaar/Visual-Dashboard.git
  cd Visual-Dashboard
  git checkout main
  npm install
  cd client
  npm install
Setup ENV. variables and run app with npm start on both dir root/frontend