
AI-agent-native observability platform


Quickstart • Features • CLI Reference • Architecture • Design Doc
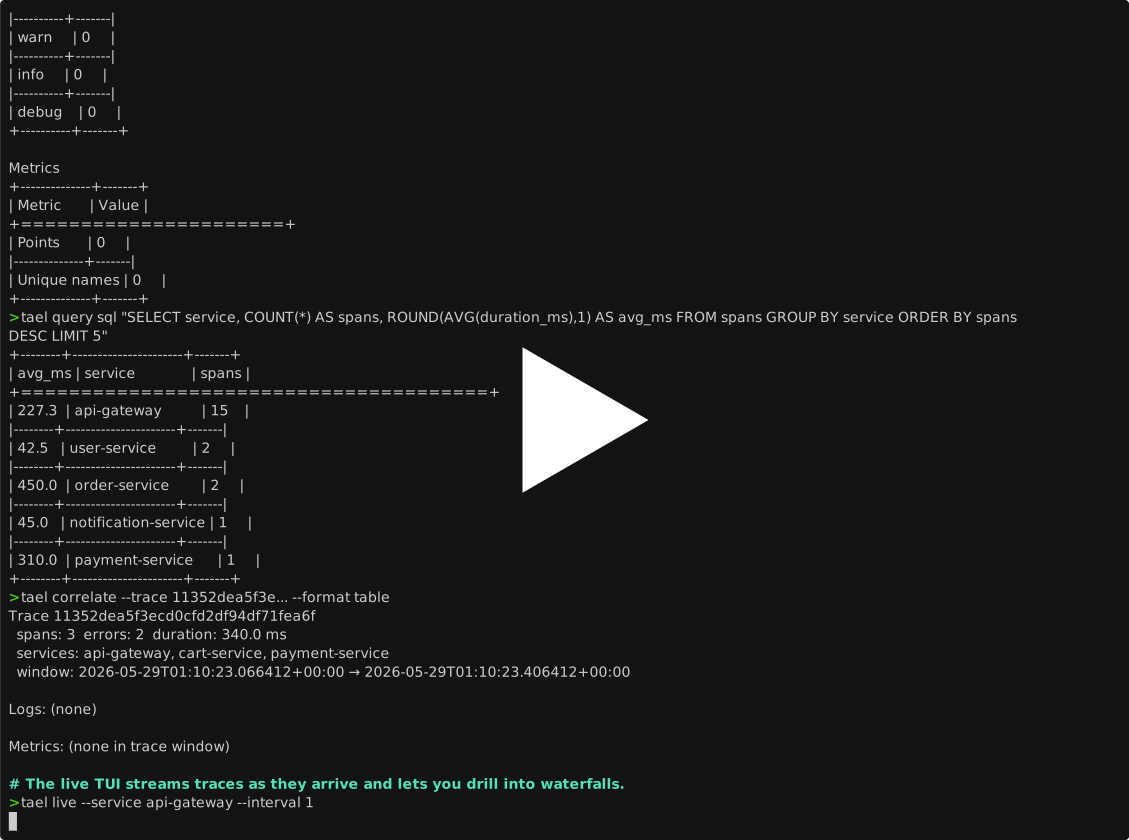
tael is an observability platform built for AI agents. It ingests OpenTelemetry traces, logs, and metrics via standard OTLP (plus Prometheus remote-write and the Datadog trace-agent protocol), stores them in a purpose-built tiered engine tuned for OTel + LLM traces, and exposes a CLI-first interface that returns structured JSON — designed for agents like Claude Code, Devin, or custom autonomous systems to query, monitor, and annotate production telemetry programmatically.
One tael binary — server, CLI, and TUI in one (plus an optional desktop GUI) —
with structured data as the default interface.
Supported on macOS (Intel + Apple Silicon) and Linux (x86_64 + aarch64). Windows is not supported — a dependency in the WAL uses unix-only file I/O.
# Fastest — download a prebuilt `tael` binary (no compilation)
cargo binstall tael-cli
cargo install tael-cli also works but compiles from source, so it can take
several minutes. cargo binstall fetches a prebuilt binary from the GitHub
Release instead and finishes in seconds. Install it once with
cargo install cargo-binstall (or grab it from
its releases).
Both install the headless server/CLI by default. The desktop GUI (tael gui)
is opt-in via --features gui, which links Tauri/WebKit and needs the native
GUI build dependencies for your platform — so it must be compiled from source
(cargo install, not cargo binstall).
# Compiles from source — slower, but no extra tooling
cargo install tael-cli

# Opt in to the desktop GUI (`tael gui`)
cargo install tael-cli --features gui

# Optional legacy DuckDB storage backend
cargo install tael-cli --features duckdb
Or build from source:
cargo build --releaseA prebuilt, multi-arch (amd64 + arm64) image is published to GHCR on every release, so there is no source build:
docker run --rm \
  -p 7701:7701 -p 4317:4317 -p 4318:4318 -p 8126:8126 \
  -v tael-data:/data \
  ghcr.io/thousandbirdsinc/tael:latest
That starts tael serve with OTLP gRPC on :4317, OTLP/HTTP on :4318,
the REST API on :7701,
and the Datadog trace-agent intake on :8126,
persisting telemetry to the tael-data volume. Point your app's OTLP exporter
at http://localhost:4317 and query from the host with a locally installed
tael, or run the CLI inside the container:
docker exec <container> tael --format json servicesTo embed tael in your own image, use it as a base — the tael binary is on
PATH and serve is the default command:
FROM ghcr.io/thousandbirdsinc/tael:latest
# your OTLP-emitting app alongside it, or override CMD to run a query
The image is server/CLI only; the desktop GUI (tael gui) is desktop-only and
is compiled out of the container build.
The tael gui window is opt-in. The default install (and the prebuilt
cargo binstall / Docker binaries) is a headless server/CLI build that does not
link Tauri/WebKit — so it runs anywhere, including servers and containers that
have no GTK/WebKit libraries.
To get the desktop app, compile from source with the gui feature:
cargo install tael-cli --features guicargo binstall cannot deliver the GUI — the prebuilt binaries are headless, so
the GUI always builds from source. You need the native WebKit/GTK build
dependencies for your platform:
- macOS — nothing extra; WebKit ships with the OS.
- Debian/Ubuntu —
sudo apt-get install libwebkit2gtk-4.1-dev libayatana-appindicator3-dev librsvg2-dev patchelf - Other Linux distros — install the equivalent
webkit2gtk,libappindicator/libayatana-appindicator, andlibrsvgdevelopment packages.
Running tael gui from a headless build prints a reminder to reinstall with
--features gui.
# Start the server (OTLP gRPC on :4317, OTLP/HTTP on :4318, REST API on :7701, dd-trace agent on :8126)
tael serve

# In another terminal — send sample traces
cargo run --bin tael-test

# Query
tael services --format table
tael query traces --status error --format table
tael query traces --min-duration 500ms --last 1h
tael get trace <trace-id> --format json

# Interactive TUI
tael live

# Desktop GUI (requires a build with `--features gui`; see Installation)
tael guiAccepts traces, logs, and metrics from any OpenTelemetry-instrumented application via standard OTLP gRPC (port 4317) or OTLP/HTTP (port 4318, protobuf and JSON, gzip supported), plus Prometheus remote-write over HTTP (POST /api/v1/write). No proprietary SDKs or agents required. LLM spans (gen_ai.* semantic conventions) get typed model/token/cost fields, with prompt/completion payloads stored as deduplicated blobs.
tael also speaks the Datadog trace-agent protocol (/v0.3, /v0.4, and
/v0.5 traces in msgpack or JSON, plus the /info discovery endpoint), so a
project already instrumented with a dd-trace library works without
re-instrumenting — no Datadog agent needed. By default tael serve listens on
the agent's standard port (127.0.0.1:8126), so dd-trace clients need zero
configuration: just run your service. The same endpoints are also mounted on
the REST listener, so pointing explicitly works too:
export DD_TRACE_AGENT_URL=http://127.0.0.1:7701 # optional; :8126 is automaticIf something else already holds port 8126 (say, a real Datadog agent), tael
logs a warning and keeps running with the REST-listener intake only. Move or
disable the dedicated listener with --dd-agent-addr <addr|off> or
TAEL_DD_AGENT_ADDR.
Datadog meta/metrics tags become span attributes (resource and type
land on resource.name / span.type), the error flag maps to span status,
and 64-bit Datadog trace ids are widened to 128-bit ids via the _dd.p.tid
tag when present. Client stats and telemetry uploads are accepted and
discarded.
Every command returns structured JSON by default. Human-readable tables via --format table.
# Find errors across all services
tael query traces --status error --format json

# Find slow requests
tael query traces --min-duration 500ms --service api-gateway

# Full trace with span hierarchy, attributes, and events
tael get trace <trace-id>

# Service health overview
tael services

# Cross-signal queries
tael query logs --severity error --last 1h
tael query metrics --query 'sum by (service) (http_requests)'
tael query sql "SELECT service, COUNT(*) AS errors FROM spans WHERE status = 'error' GROUP BY service"Agents can annotate traces with comments — useful for collaborative debugging, audit trails, or recording investigation notes.
# Add a comment to a trace
tael comment add <trace-id> "Root cause: expired DB connection pool" --author oncall-bot

# Attach a comment to a specific span
tael comment add <trace-id> "This query needs an index" --span-id <span-id>

# View comments
tael comment list <trace-id>Agent-friendly analysis commands built on top of the core query layer.
# Aggregated health digest over a window (traces, top services, top error
# ops, log severity breakdown, metric volume)
tael summarize --last 1h
tael summarize --last 15m --service api-gateway --format table

# Services whose error rate or p95 regressed vs a baseline window
tael anomalies --last 5m --baseline 30m
tael anomalies --last 10m --baseline 2h --service cart

# Pull spans, logs, and time-window metrics for a single trace
tael correlate --trace <trace-id>

# Poll the summary endpoint on an interval and print signed deltas per tick
tael watch --last 1m --interval 10
anomalies flags a service when its current-window error rate rises ≥5%
absolute over baseline, or p95 latency regresses ≥1.5× (severity bumps at
10%/25% error delta and 2×/3× latency ratio). correlate takes a trace ID
and returns the spans, any logs tagged with that trace_id, and metrics
from the touched services within the trace's time range.
Tael evals are designed around the full execution trace, not a narrow result row. Eval runs, scores, comments, large artifacts, and live progress reuse the same spans, metrics, comments, blobs, SQL, and TUI that production debugging uses.
The roadmap extends this into a floor-raising loop for agent reliability:
production trace -> failure classification -> issue/signal -> golden case -> fix -> compare -> monitor
Commands include tael issue for recurring failure patterns, tael signal for
long-running behavior monitoring, tael eval case add --from-trace for
promoting production failures into golden regression cases, tael eval suite inspect for suite hygiene, and tael experiment compare for validating model,
prompt, tool, retrieval, or guardrail changes against production outcomes.
The initial implementation is intentionally comment-backed: issues, signal definitions, eval case provenance, and self diagnostics are structured trace comments, so they stay attached to the trace that motivated them.
Paired with Chidori — the agent
framework whose runs are durable and replayable by default — the loop closes
into a full self-improvement harness: tael mines weaknesses from traces and
validates fixes; Chidori supplies the experiment substrate (fork a controlled
chidori.branch experiment from a failure's exact anchored state, replay any
golden case byte-for-byte at $0). A tael eval case add --from-trace on a
Chidori trace records the run's checkpoint as the case fixture automatically.
See Tracing Chidori agents and the runnable
self-harness-loop demo.
            ┌──────────────── tael ────────────────┐
            │  traces · issues · signals · evals   │
            │  (weakness mining + validation)      │
            └───────▲──────────────────┬───────────┘
             OTLP   │                  │ eval run --cmd
                    │                  ▼
            ┌───────┴───────── chidori ────────────┐
            │  durable runs · checkpoints · branch │
            │  (the experiment substrate)          │
            └──────────────────────────────────────┘
# Classify a representative production failure
tael issue create --from-trace <trace-id> \
  --failure-mode tool_error --impact high \
  --summary "search tool timed out before answer synthesis"
tael issue list --format table
tael issue examples <issue-id>

# Promote the failure into a regression case and inspect suite hygiene
tael eval case add --from-trace <trace-id> --suite support-agent \
  --case-id search-timeout-001 --failure-mode tool_error \
  --source-issue-id <issue-id> --critical-path \
  --expected-behavior "Retries or degrades gracefully without hallucinating"
tael eval case link --case-id search-timeout-001 --issue-id <issue-id>
tael eval suite inspect support-agent --format table

# Run and score trace-native evals
tael eval run cases.jsonl --suite support-agent \
  --cmd './run_case.sh {case_id}' --code-version "$(git rev-parse --short HEAD)"
tael eval score <run-id> scores.jsonl
tael eval report <run-id> --format table
tael eval compare <run-id> <baseline-run-id> --format table

# Track long-running reliability signals and experiment variants
tael signal create --from-trace <trace-id> --name context_loss \
  --failure-mode context_loss --summary "agent lost required source context"
tael signal trend context_loss --format table
tael experiment compare checkout-prompt-v2 --signal context_loss --last 24h

# Record untrusted agent self diagnostics for later review
tael diagnose report --trace-id <trace-id> --category missing_context \
  --severity medium --confidence low --summary "could not find policy source"
tael diagnose list --format tabletael ships with a Claude Code skill so Claude Code picks up telemetry-querying instructions automatically when you're debugging inside a project that uses tael. Install it once:
# Personal install (~/.claude/skills/tael/SKILL.md) — available in every project
tael skill install

# Project-scoped install (.claude/skills/tael/SKILL.md) — committed to this repo
tael skill install --project

# Overwrite an existing install
tael skill install --force

# Just show where it would be written
tael skill where
Restart any running Claude Code session after the first install so it picks up the new skill directory. Subsequent --force re-installs take effect within the session.
tael live launches a terminal UI with a live-updating trace feed, service
health, a waterfall trace visualizer, and panels for the rest of the query
surface. Number keys switch tabs — 1 through 9, then 0.
┌─ tael ─────────────────────────────────────────────────────┐
│  1:Traces 2:Services 3:Evals 4:Timeline 5:Health 6:Topology │
│  7:Automation 8:Clusters 9:Review 0:SQL              Trace │
├────────────────────────────────────────────────────────────-┤
│ Trace a1b2c3… │ 340ms │ 3 spans                           │
│                  0ms        170ms       340ms              │
│ api-gateway    ████████████████████████████████   340ms    │
│   cart-service ██                                  15ms    │
│   payment-svc  ▓▓▓▓▓▓▓▓▓▓▓▓▓▓▓▓▓▓▓▓▓▓▓▓▓▓▓▓▓   310ms    │
├────────────────────────────────────────────────────────────-┤
│ span_id: ab4e…  service: payment-svc  status: error       │
│ attrs: payment.provider=stripe  error.type=PaymentDeclined │
│ event(exception): Card declined: insufficient funds        │
├────────────────────────────────────────────────────────────-┤
│ Comments (2)                                               │
│ 06:53:19 oncall-bot: Payment declined — Stripe 402         │
│ 06:53:20 debug-agent: Card expired. Not a system issue.    │
└────────────────────────────────────────────────────────────-┘
 ctrl-c:quit  q/esc:back  j/k:navigate  c:comment
| Tab | What it shows |
|---|---|
| Traces / Timeline / Trace | Live span feed, trace-level timeline, and the waterfall for one trace |
| Services | Per-service span counts, latency, and error rate |
| Evals | The most recent eval run and its cases |
| Health | summarize plus anomalies against a baseline four windows back |
| Topology | The service graph, and how many spans had a parent outside the window |
| Automation | Alert rules and their state, the firing feed, and scoring-rule progress |
| Clusters | Grouped failures with cohesion, labelled weak below 0.7 |
| Review | Questions an agent filed for a human, open ones first |
| SQL | A read-only query console (e to edit, r to run) |
The panels are read-only. Creating an alert rule or answering a review request
is an agent's job and stays in the CLI, where it can be scripted and its exit
code checked. enter on a cluster exemplar or a review request opens that
trace. The desktop GUI (tael gui) carries the same tabs.
Controls:
| Key | Action |
|---|---|
1–9, 0 |
Switch tabs, in the order shown in the header |
j / k |
Navigate up/down |
Enter |
Open trace waterfall visualizer |
q / Esc / Backspace |
Go back (leave trace view, or clear active filters) |
c |
Add comment (in trace view) |
r |
Re-fetch the open panel |
e |
Edit the query (SQL panel) |
Space |
Pause/resume live updates |
Ctrl-C |
Quit |
tael [OPTIONS] <COMMAND>

Commands:
  serve           Run the server (OTLP + dd-trace ingest + storage + REST API)
  query traces    Search and filter traces (--text for LLM payload search)
  query logs      Search and filter logs
  query metrics   Query metrics (incl. PromQL subset)
  query sql       Read-only SQL over the telemetry tables
  get trace       Get a full trace by ID
  services        List known services and their health
  comment add     Add a comment to a trace
  comment list    List comments on a trace
  live            Interactive TUI trace feed
  summarize       Aggregated health summary over a window
  anomalies       Surface services that regressed vs a baseline window
  correlate       Pull spans + logs + metrics for a trace ID
  watch           Poll the summary endpoint and print deltas per tick
  eval            Collect, score, report, and compare trace-native evals
  issue           Classify production failures into recurring issues
  signal          Define and inspect long-running reliability signals
  experiment      Compare production experiment variants
  diagnose        Record and list untrusted agent self diagnostics
  skill install   Install the tael skill into Claude Code
  server status   Check server health

Global Options:
  --format <json|table>   Output format (default: json)
  --server <URL>          Server address (default: http://127.0.0.1:7701)
  --port-rest <N>         Shorthand for --server http://127.0.0.1:<N>;
                          for `serve`, sets the REST API listen port.
                          Conflicts with --server.
  --port-otel <N>         (serve only) OTLP gRPC ingest listen port on
                          127.0.0.1. Ignored by client commands.
Runs the server in the same binary. Flags fall back to the matching env var (see Configuration), then to the defaults.
| Flag | Description | Default |
|---|---|---|
--otlp-grpc-addr |
OTLP gRPC listen address | 127.0.0.1:4317 |
--otlp-http-addr |
OTLP/HTTP listen address; off disables the dedicated listener |
127.0.0.1:4318 |
--rest-api-addr |
REST API listen address | 127.0.0.1:7701 |
--dd-agent-addr |
Datadog trace-agent listen address; off disables the dedicated listener |
127.0.0.1:8126 |
--data-dir |
Telemetry data directory | ~/.tael/data |
--wal-dir |
Write-ahead log directory | ~/.tael/wal_files |
--storage |
Storage backend. duckdb requires installing with --features duckdb |
tael-backend |
| Flag | Description | Example |
|---|---|---|
--service |
Filter by service name | --service api-gateway |
--operation |
Filter by operation (substring) | --operation checkout |
--status |
Filter by status | --status error |
--min-duration |
Minimum span duration | --min-duration 500ms |
--max-duration |
Maximum span duration | --max-duration 1s |
--last |
Time window | --last 1h |
--limit |
Max results (default 100) | --limit 50 |
--attribute |
Exact span-attribute match, repeatable and ANDed | --attribute http.status_code=500 |
--text |
Full-text search over LLM prompt/completion payloads in tael-backend storage |
--text "rate limit" |
| Flag | Description | Example |
|---|---|---|
--service |
Filter by service name | --service api |
--severity |
Filter by severity (trace, debug, info, warn, error, fatal) |
--severity error |
--body-contains |
Substring search over log body text | --body-contains timeout |
--trace-id |
Exact trace ID match | --trace-id a1b2c3... |
--last |
Time window | --last 1h |
--limit |
Max results (default 100) | --limit 50 |
| Flag | Description | Example |
|---|---|---|
--service |
Filter by service name; ignored when --query is set |
--service api |
--name |
Filter by metric name; ignored when --query is set |
--name http_requests |
--type |
Filter by metric type (gauge, sum, histogram, summary) |
--type gauge |
--query |
PromQL subset expression | --query 'rate(http_requests[5m])' |
--last |
Time window or PromQL selector lookback | --last 5m |
--limit |
Max results in filter mode (default 500) | --limit 1000 |
PromQL support is intentionally small: bare selectors, {label="value"}
with exact (=, !=) and anchored regex (=~, !~) matchers,
rate(metric[5m]), sum|avg|min|max|count with optional by (...),
histogram_quantile(phi, selector), and a top-level scalar comparison
(<expr> > 0.05). Binary operators between series, subqueries, offset, and
range queries are not supported.
Runs read-only SQL over spans, logs, metrics, and trace_comments.
Only SELECT/WITH statements are accepted.
tael query sql "SELECT service, COUNT(*) AS n FROM spans GROUP BY service ORDER BY n DESC"| Flag | Description | Example |
|---|---|---|
--service |
Filter live trace feed by service | --service api |
--status |
Filter live trace feed by status | --status error |
--interval |
Poll interval in seconds (default 2) | --interval 1 |
--evals |
Open the eval progress view | --evals |
--eval-run |
Open a specific eval run in the eval progress view | --eval-run run_20260528_120000 |
| Flag | Description | Example |
|---|---|---|
--last |
Time window (default 1h) | --last 15m |
--service |
Filter to a single service | --service cart |
| Flag | Description | Example |
|---|---|---|
--last |
Current window (default 1h) | --last 5m |
--baseline |
Baseline window (default 6× current) | --baseline 1h |
--service |
Filter to a single service | --service api |
| Flag | Description | Example |
|---|---|---|
--trace |
Trace ID to pull across signals | --trace a1b2c3… |
| Flag | Description | Example |
|---|---|---|
--last |
Summary window (default 1m) | --last 30s |
--service |
Filter to a single service | --service api |
--interval |
Poll interval in seconds (default 10) | --interval 5 |
| Command | Description |
|---|---|
eval run <cases.jsonl> --suite <suite> --cmd <cmd> |
Run a shell command once per JSONL case with TAEL_EVAL_* env vars and runner spans |
eval score <run-id> <scores.jsonl> |
Ingest JSONL score records as tael_eval_score metric points |
eval runs |
List recent eval runs |
eval status <run-id> |
Show one eval run summary |
eval cases <run-id> |
List cases in a run |
eval scores <run-id> |
List raw scores in a run |
eval report <run-id> |
Render status and cases together |
eval compare <run-id> <baseline-run-id> |
Compare score metrics against a baseline run |
eval case add --from-trace <trace> --suite <suite> --case-id <id> |
Promote a production trace into a golden case comment |
eval case link --case-id <id> --issue-id <issue> |
Link an eval case to a recurring issue |
eval suite inspect <suite> |
Inspect case provenance, expected behavior coverage, critical-path count, and duplicate failure modes |
eval run templates support {case_id}, {case_index}, {run_id}, and
{suite_id}. Child commands receive TAEL_EVAL_SUITE_ID,
TAEL_EVAL_RUN_ID, TAEL_EVAL_CASE_ID, TAEL_EVAL_CASE_INDEX,
TAEL_EVAL_CASE_COUNT, TAEL_EVAL_TRACE_ID, TAEL_EVAL_SPAN_ID, and
OTEL_EXPORTER_OTLP_ENDPOINT.
| Command | Description |
|---|---|
issue create --from-trace <trace> --failure-mode <mode> --impact <level> --summary <text> |
Create a structured recurring-issue comment from a representative trace |
issue list |
List known recurring issues |
issue examples <issue-id> |
List comments and cases linked to an issue |
signal create --from-trace <trace> --name <name> |
Define a long-running signal from a trace |
signal trend <name> |
Count matching signal, failure-review, and self-diagnostic comments by day |
experiment compare <experiment-id> |
Compare variants tagged with tael.experiment.id and tael.experiment.variant span attributes |
diagnose report --trace-id <trace> --category <category> --severity <level> --summary <text> |
Record an untrusted agent self diagnostic as a trace comment |
diagnose list |
List self diagnostics |
The reliability-loop commands are deliberately comment-backed. They scan structured JSON trace comments rather than requiring a separate issues or eval database, which keeps provenance attached to the original trace.
Server and client are the same tael binary — tael serve runs the
ingest/storage/API side; the other subcommands are the client.
┌──────────────────────────────┐
│         Data Sources         │
│  (OTel-instrumented apps)    │
└──────────┬───────────────────┘
           │ OTLP gRPC :4317 · OTLP/HTTP :4318 · Prometheus remote-write (HTTP) · Datadog trace-agent (HTTP)
           ▼
┌──────────────────────────────────────────────┐
│   tael serve                                   │
│                                                │
│  ┌──────────────────────────────────────────┐ │
│  │  OTLP receivers: traces · logs · metrics  │ │
│  │  (tonic gRPC + axum)                       │ │
│  └──────────────────┬───────────────────────┘ │
│                     ▼                          │
│  ┌──────────────────────────────────────────┐ │
│  │  tael-backend (default) — Store trait      │ │
│  │   WAL → LSM hot tier → Parquet cold tier   │ │
│  │   content-addressed blobs · Tantivy search │ │
│  │   (optional --features duckdb fallback)     │ │
│  └──────────────────┬───────────────────────┘ │
│                     ▼                          │
│  ┌──────────────────────────────────────────┐ │
│  │  REST API (axum)  :7701                    │ │
│  └──────────────────────────────────────────┘ │
└──────────────────────┬─────────────────────────┘
                       │ HTTP
                       ▼
┌──────────────────────────────────────────────┐
│   tael <query|get|comment|live|summarize|…>    │
└──────────────────────────────────────────────┘
See docs/tael-backend-design.md for the storage
engine and docs/tael-server-scaling-ha.md for
the horizontal-scale / HA path.
Both workspace crates are libraries, so other projects can pull tael's
functionality into their own binaries instead of shelling out to a tael
process:
tael-cli(cratetael_cli) — the whole CLI surface: the clap command tree, the typed REST client, the JSON/table output renderers, and the interactivetael liveTUI. Thetaelbinary itself is a one-line wrapper around this library.tael-server(cratetael_server, re-exported astael_cli::tael_server) — the OTLP ingest, tiered storage, and REST/gRPC query server, runnable in-process.
[dependencies]
tael-cli = "0.5"
Mount the full CLI — including tael live — inside your own clap app by
nesting tael_cli::Commands and flattening tael_cli::GlobalOpts, then
dispatching with tael_cli::run_command:
use clap::{Parser, Subcommand};

#[derive(Parser)]
struct MyApp {
    #[command(subcommand)]
    command: MyCommand,
    #[command(flatten)]
    tael_opts: tael_cli::GlobalOpts,
}

#[derive(Subcommand)]
enum MyCommand {
    /// Your app's own commands…
    Deploy,
    /// …with every tael subcommand mounted under `myapp tael <cmd>`
    #[command(subcommand)]
    Tael(tael_cli::Commands),
}

#[tokio::main]
async fn main() -> anyhow::Result<()> {
    let app = MyApp::parse();
    match app.command {
        MyCommand::Deploy => todo!(),
        MyCommand::Tael(cmd) => tael_cli::run_command(cmd, &app.tael_opts).await,
    }
}
Or use the pieces individually:
// In-process server (quiet: no banner, host keeps its tracing subscriber).
tokio::spawn(tael_cli::tael_server::run_embedded(
    tael_cli::tael_server::ServerConfig::from_env(),
));

// Typed queries — structured JSON, no subprocess.
let client = tael_cli::TaelClient::new("http://127.0.0.1:7701");
let traces = client
    .query_traces(Some("checkout"), None, None, None, Some("error"), Some("1h"), 50, &[], None)
    .await?;

// Hand the terminal to the live trace-feed TUI; it restores the terminal
// when the user quits, so the host app carries on afterward.
tael_cli::tui::run_with_options(
    "http://127.0.0.1:7701",
    tael_cli::tui::LiveOptions { service: Some("checkout".into()), ..Default::default() },
)
.await?;
A complete runnable host application lives in
tael-cli/examples/embedded.rs
(cargo run -p tael-cli --example embedded -- --live).
The tael binary is published as tael-cli, which embeds tael-server as a
library — so cargo install tael-cli is the whole server/CLI/TUI stack, and
tael-cli is itself a library other projects can embed (see
Embedding tael as a library). The desktop GUI
(tael-gui) is an optional library pulled in only with --features gui.
Use tael_server::run(config) for a user-facing server process. In-process
integrations that must preserve one-shot JSON output or TUI control of the
terminal should use tael_server::run_embedded(config) or
run_with_options(config, ServerRunOptions::quiet()); quiet mode skips Tael's
startup banner and default tracing subscriber setup.
├── tael-server/     # Library: OTLP ingestion, tiered storage, REST/gRPC API
│   └── src/
│       ├── lib.rs        # tael_server::run / run_embedded
│       ├── config.rs
│       ├── ingest/       # OTLP traces/logs/metrics + Prometheus remote-write
│       ├── storage/      # Store trait, models, query layer
│       │   ├── backend/  # tael-backend: wal, hot (LSM), cold (Parquet)
│       │   ├── blobs.rs   #   content-addressed payload store
│       │   ├── search.rs  #   Tantivy full-text index
│       │   └── duckdb_store.rs  # legacy --storage=duckdb backend
│       └── api/          # REST endpoints (axum)
├── tael-cli/        # The `tael` binary + embeddable CLI library
│   ├── examples/
│   │   └── embedded.rs  # Host-app example: in-process server + CLI + live TUI
│   └── src/
│       ├── lib.rs       # Public API: Cli/Commands/GlobalOpts, run_command
│       ├── main.rs      # Thin binary: Cli::parse().run()
│       ├── client.rs    # HTTP client to the server REST API (TaelClient)
│       ├── tui.rs       # Interactive `live` TUI (ratatui), LiveOptions
│       ├── output.rs    # JSON + table formatters
│       └── commands/    # Subcommand handlers
├── tael-gui/        # Tauri desktop GUI launched by `tael gui`
│   ├── src/         # TypeScript frontend
│   └── src-tauri/   # Rust Tauri shell and packaged frontend assets
├── tael-test/       # Sample OTLP emitter for testing
├── docs/            # Storage-engine design, impl plan, scaling/HA
├── DESIGN.md        # Full design document
└── mise.toml        # Rust 1.87 toolchain
| Component | Choice | Why |
|---|---|---|
| Language | Rust | Fast, single binary, memory-safe |
| Storage | tael-backend | Tiered engine: WAL (walrus) + LSM hot tier (fjall) + Parquet cold tier (arrow/parquet) + content-addressed blobs + Tantivy search |
| Storage (fallback) | DuckDB | Optional embedded columnar DB, --features duckdb + --storage duckdb. Migrate existing DuckDB data onto the default engine with tael server migrate (offline, --dry-run to preview) |
| CLI | clap | Standard Rust CLI framework |
| GUI | Tauri | Desktop app embedded in the installed tael binary |
| API | axum | Async REST on tokio |
| gRPC | tonic | OTLP ingestion |
| TUI | ratatui | Terminal UI with waterfall visualization |
| OTel | opentelemetry-proto | Standard OTLP protobuf decoding |
The server (tael serve) is configured via flags or environment variables
(flags win):
| Variable | Default | Description |
|---|---|---|
TAEL_OTLP_GRPC_ADDR |
127.0.0.1:4317 |
OTLP gRPC listen address |
TAEL_OTLP_HTTP_ADDR |
127.0.0.1:4318 |
OTLP/HTTP listen address (off to disable) |
TAEL_INGEST_MAX_IN_FLIGHT |
512 |
Max concurrent in-flight ingest batches before new batches are shed with a retryable status (0 = unbounded) |
TAEL_METRIC_SERIES_LIMIT |
100000 |
Max distinct metric series this process accepts; points minting series beyond the cap are dropped and counted (0 = unbounded) |
TAEL_BLOB_GC_PEERS |
— | Comma-separated base URLs of other writers sharing the blob store; the GC owner unions their live blob sets (via /internal/blobs/live) before sweeping, and skips the pass if any peer is unreachable |
TAEL_REST_API_ADDR |
127.0.0.1:7701 |
REST API listen address |
TAEL_DATA_DIR |
~/.tael/data |
Telemetry data directory |
TAEL_WAL_DIR |
~/.tael/wal_files |
Write-ahead log directory |
TAEL_STORAGE |
tael-backend |
Storage backend. duckdb requires a build with --features duckdb |
TAEL_COLD_DIR |
<data_dir>/cold |
Override the Parquet cold-tier location (e.g. an object-store mount) |
TAEL_HOT_TIER_HOURS |
24 |
Hot-tier window before data rolls to the cold tier |
TAEL_COMPACT_INTERVAL_SECS |
3600 |
Compaction / retention / blob-GC interval |
TAEL_TRACE_RETENTION_DAYS |
365 |
Span metadata retention in the cold tier |
RUST_LOG |
info |
Log level |
# Prerequisites: Rust 1.87+ (or use mise)
mise install

# Build (server + CLI + test data generator; the Tauri GUI crate is excluded
# from the default build — use `cargo build -p tael-gui` when working on it)
cargo build

# Run server (alias for `cargo run --bin tael -- serve`)
./run-server.sh

# Send test data
cargo run --bin tael-test

# Run CLI
cargo run --bin tael -- query traces --format tableSee DESIGN.md for the full design document and milestone plan.
- M1: OTLP trace ingestion, embedded storage, CLI queries, trace comments, TUI
- M2: Metrics + logs ingestion, PromQL subset
- M3:
tael summarize,tael anomalies,tael correlate,tael watch - M3.5: comment-backed floor-raising reliability loop: issues, signals, trace-to-golden-case promotion, suite hygiene, production experiment comparison, and self-diagnostic conventions — see
docs/tael-evals-design.md - tael-backend: purpose-built tiered storage engine (WAL + LSM hot tier + Parquet cold tier + content-addressed blobs + full-text search), now the default — see
docs/tael-backend-design.md - M4: object-store cold tier + horizontal scale / HA (
docs/tael-server-scaling-ha.md), MCP server, auth
MIT