


A feature-rich Grafana panel plugin for monitoring system status with configurable thresholds, alert sounds, and visual feedback.
- Color-coded status levels — OK, Information, Warning, Average, High, Disaster, Disabled, N/A
- Blink animation on status change with configurable duration (5–60 seconds)
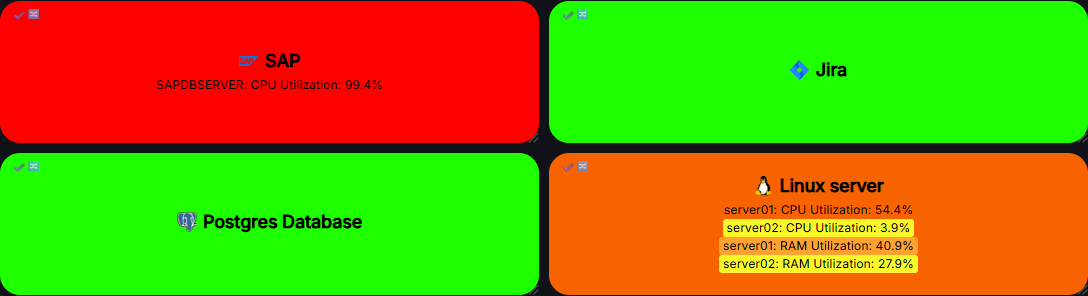
- Colorize each metric by its individual status level
- Corner radius control (0–50 px)
- Custom icon — choose from built-in Grafana icons or provide a custom image URL
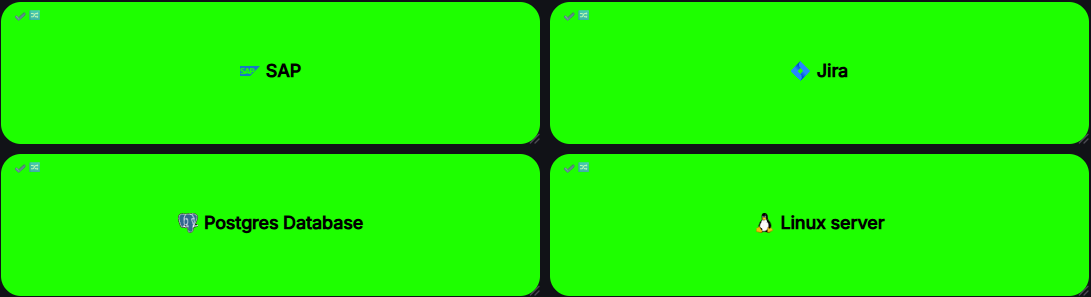
- Tag label — short text displayed in the top-left corner
- Timestamp of last status change shown in the top-right corner (Time / Date+Time / Relative formats)
- Panel link — clicking the panel name opens a configurable URL (supports Grafana variables)
- Custom text color with automatic contrast fallback for light/dark themes
- Adjustable font sizes for title and metrics independently
- Line-by-line or inline (comma-separated) display modes
- Metric URL — click any metric name to open its URL
- Alias — display a custom name instead of the raw metric name
- Description tooltip — hover over a metric to see its description
- Show/hide metric name and value independently per rule
- 5 built-in tones generated via Web Audio API, one per severity level
- Custom audio URL — play any MP3/OGG from a URL
- Per-status configuration — each status level can be set to Off / Built-in / Custom URL independently
- Volume control (0–100%)
- Sound preview button in the settings panel
- Regex metric matching with real-time validation and error highlighting
- Number threshold mode — trigger by numeric value with per-level thresholds
- String threshold mode — trigger by exact string value
- Show-only mode — always display the metric regardless of value
- Reverse logic — trigger when value is ≤ threshold instead of ≥
- Drag & drop reordering via
@dnd-kit - Duplicate any rule with one click
- Export / Import rules to/from JSON file
- Search — filter rules by name, metric, or alias (appears when >3 rules)
- Switch to N/A on data source error — prevents misleading green status during outages
- Custom error message — show your own text when the data source fails
- No flicker during refresh — keeps last known error state during
Loading
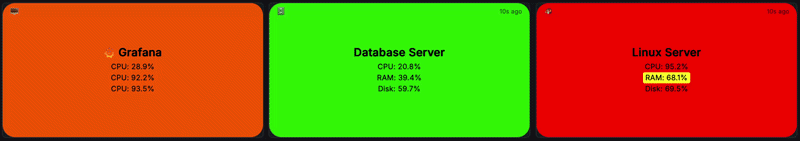
| Panel — OK | Panel — Multiple statuses |
|---|---|
|
|
| General Settings | Link & Icon Settings |
|---|---|
 |
| Blink & Sound Settings | Colors Settings |
|---|---|
 |
 |
| Rule Editor | Threshold Settings |
|---|---|
 |
 |
- Grafana 10.0.0 or newer
- Node.js 20+ (for building from source)
Coming soon — submission to the official Grafana plugin catalog is in progress.
-
Download the latest release archive from the Releases page.
-
Extract it into your Grafana plugins directory:
# Default plugin directory on Linux unzip toropovav-status-panel-1.0.0.zip -d /var/lib/grafana/plugins/ -
Allow unsigned plugins in
grafana.ini:[plugins] allow_loading_unsigned_plugins = toropovav-status-panel
-
Restart Grafana:
sudo systemctl restart grafana-server
-
Open Grafana → add a new panel → select Status Panel from the visualization list.
git clone https://github.com/ToropovAV/status-panel.git
cd status-panel
npm install
npm run build
Then copy the dist/ folder into your Grafana plugins directory (see Option 2, step 2).
To run in development mode with hot reload:
npm run dev| Setting | Description | Default |
|---|---|---|
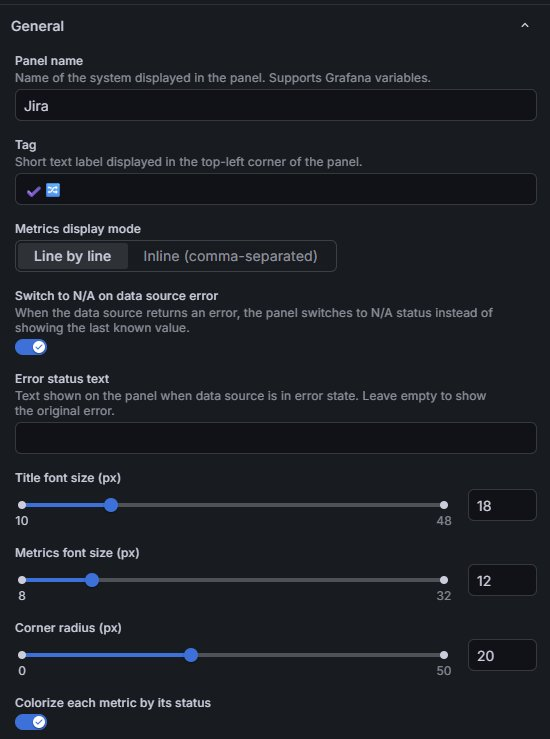
| Panel name | Title displayed in the center. Supports Grafana variables. | System Name |
| Tag | Short label in the top-left corner. | — |
| Metrics display mode | Line by line or Inline (comma-separated) |
Line by line |
| Switch to N/A on data source error | Show N/A status when the data source fails. | On |
| Error status text | Custom message shown on the panel during an error. Leave empty to show the original error. | — |
| Title font size | Panel title font size in px. | 18 |
| Metrics font size | Metric rows font size in px. | 12 |
| Corner radius | Panel border radius in px. | 20 |
| Colorize each metric by its status | Highlight each metric row with its own status color. | On |
| Show last status change time | Timestamp in the top-right corner. | On |
| Timestamp format | Time only, Date + Time, or Relative (e.g. "5m ago"). |
Relative |
| State mode | Enabled (rules active), Disabled (grey), N/A (forced N/A). |
Enabled |
| Setting | Description |
|---|---|
| Panel link URL | URL opened when the panel title is clicked. Supports Grafana variables. |
| Open link in new tab | Open the link in a new browser tab. |
| Setting | Description |
|---|---|
| Icon type | None, Built-in (Grafana icon library), or Custom URL (any PNG/SVG/JPEG). |
| Icon name | Grafana icon name, e.g. database, server, cloud. See the icon reference. |
| Icon URL | URL to an external image. Must be accessible from the browser. |
| Icon size | Width/height of the custom icon in px (12–64). |
| Setting | Description | Default |
|---|---|---|
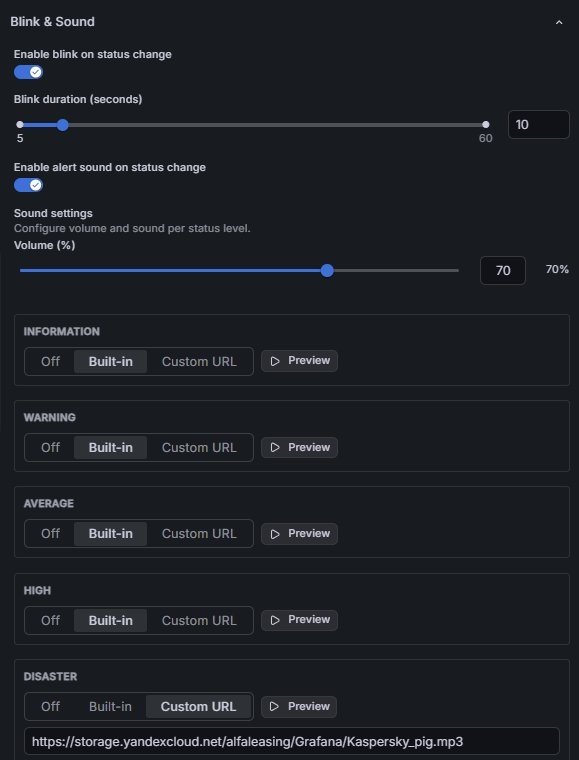
| Enable blink on status change | Animate panel opacity on status change. | On |
| Blink duration | How long the blink animation runs in seconds. | 10 |
| Enable alert sound on status change | Play a sound when status changes. | On |
| Volume | Master volume for all sounds (0–100%). | 70% |
| Per-status sound | Each level (Information → Disaster) can be Off, Built-in, or Custom URL. |
Built-in for all; Disaster uses Custom URL |
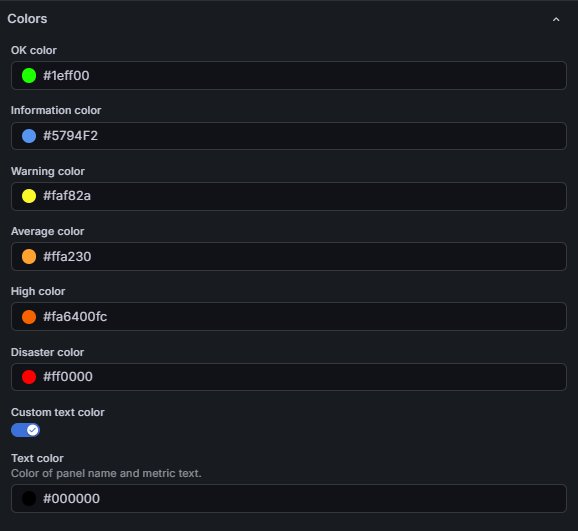
Each status level has an individually configurable color:
| Level | Default color |
|---|---|
| OK | #2cda01 |
| Information | #5794F2 |
| Warning | #faf82a |
| Average | #ffa230 |
| High | #fa6400 |
| Disaster | #ff0000 |
| Disabled | #6E6E6E |
| N/A | #B0B0B0 |
You can also set a custom text color or let the plugin auto-select one based on the background.
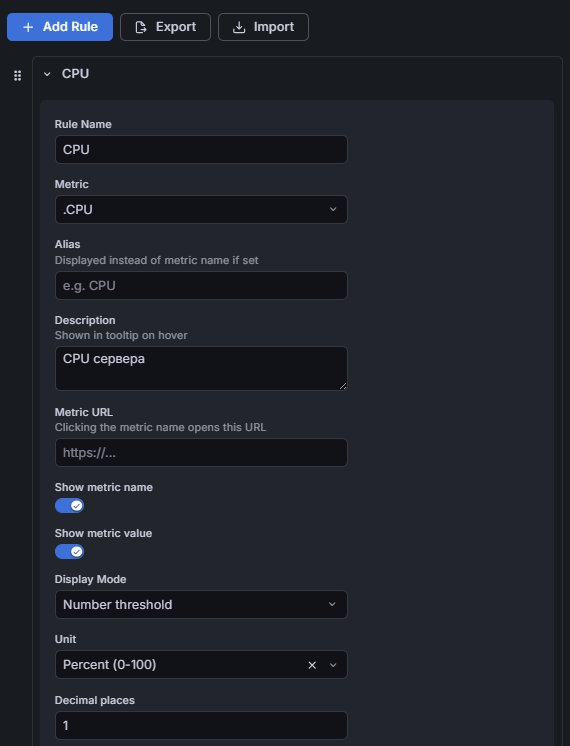
Each rule defines which metric to monitor and how to evaluate it.
| Field | Description |
|---|---|
| Rule Name | Label shown in the metrics list on the panel. |
| Metric | Metric name or regular expression to match one or more series. |
| Alias | Alternative display name (replaces the metric name on the panel). |
| Description | Tooltip shown when hovering over the metric. |
| Metric URL | URL opened when the metric name is clicked. |
| Show metric name / value | Toggle visibility of name and value independently. |
| Display Mode | Number threshold, String threshold, or Show only. |
| Unit | Unit for numeric values (uses Grafana unit picker). |
| Decimal places | Number of decimal places for numeric display. |
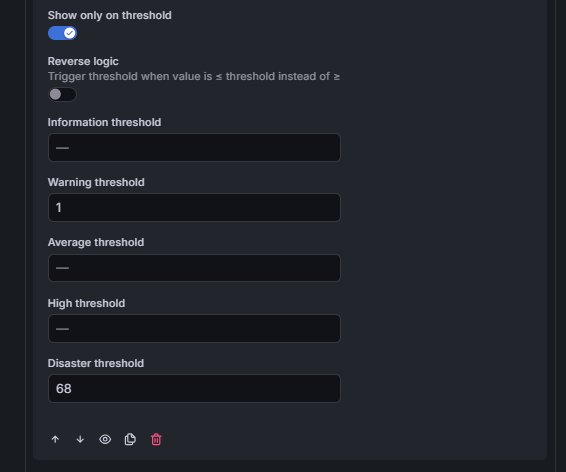
| Show only on threshold | Hide the metric when its value is within the OK range. |
| Reverse logic | Trigger when value is ≤ threshold (instead of ≥). |
| Thresholds | Per-level threshold values (Information / Warning / Average / High / Disaster). |
Rules can be exported to a JSON file and re-imported into any panel:
- Click Export in the Rules editor — saves
status-panel-rules.json. - On another panel, click Import and select the file — rules are appended to existing ones.
Levels are evaluated in ascending severity order. The panel displays the worst active status across all rules.
| Level | Meaning |
|---|---|
| OK | All thresholds within normal range |
| Information | Informational alert, no action required |
| Warning | Worth monitoring |
| Average | Moderate issue |
| High | Serious issue requiring attention |
| Disaster | Critical failure |
| Disabled | Panel manually set to disabled state |
| N/A | No data, data source error, or panel set to N/A mode |
The plugin is designed to work with any data sources and has been tested with:
If you encounter any issues with specific data sources, please leave an issue.
If you have existing dashboards built with the old plugin, use the included migration script to convert the panel JSON automatically.
revers: true→reverseLogic: true(the field that caused rules to silently not work)unit: ""/unit: "None"→unit: "none"clickThrough→metricURL- Removes legacy fields:
label,shortAlias,showMembers,isTemplated,enabled,clickThroughOpenNewTab,clickThroughSanitize - Renames color fields:
ColorOK→colorOK, etc. - Sets default values for all new fields (
soundSettings,iconType,fontSizeTitle, etc.) - Changes panel type:
serrrios-statusoverview-panel→toropovav-status-panel
# Migrate a folder of panel JSON files
python migrate_panel.py -i ./panels_old -o ./panels_new

# Migrate a single file
python migrate_panel.py -i dashboard.json -o dashboard_migrated.json

# In-place (overwrites originals — make a backup first!)
python migrate_panel.py -i ./panels -o ./panels
The script is located in the tools/ directory of this repository.
# Install dependencies
npm install

# Start dev server with hot reload
npm run dev

# Run unit tests
npm test

# Production build
npm run buildsrc/
├── components/
│ ├── StatusPanel.tsx # Main panel component
│ ├── MetricRow.tsx # Single metric row
│ └── editor/
│ ├── RuleEditor.tsx # Rules list with drag & drop
│ ├── RuleItem.tsx # Single rule form
│ ├── RuleEditor.types.ts # Rule type definitions
│ ├── SoundConfigEditor.tsx
│ └── IconReferenceButton.tsx
├── hooks/
│ ├── useStatusTransition.ts # Blink logic
│ └── useAlertSound.ts # Sound playback on transition
├── utils/
│ ├── processor.ts # DataFrame → MetricHint
│ ├── statusResolver.ts # Resolve worst status across rules
│ ├── displayBuilder.ts # Build display items list
│ ├── colorResolver.ts # Map status → color
│ ├── comparisonFunctions.ts # Threshold comparison logic
│ └── soundPlayer.ts # Web Audio + HTML Audio playback
├── constants.ts # Default colors, sounds, durations
├── types.ts # All TypeScript interfaces
└── module.ts # Plugin registration & settings schema
Apache License 2.0 — see LICENSE for details.
Aleksey Toropov
Originally inspired by the abandoned serrrios-statusoverview-panel plugin. This is a complete rewrite with no shared code.