Benchmarks on development hardware. All times include host-device transfer
where applicable. Measured with time.perf_counter() (3–5 warmup runs, mean
of 5–100 runs depending on benchmark).
- GPU: NVIDIA GeForce RTX 2050 (16 SMs, 4 GB VRAM, SM 8.6)
- CPU: AMD Ryzen 5 (6-core, 3.5 GHz)
- Memory: 16 GB DDR4 3200 MHz
- CUDA: 12.9, GCC 11.4 with
-O3 -march=native(no-ffast-math— IEEE 754 compliance)
CUDA is optional. On machines without a GPU, the C++/OpenMP backend provides similar performance.
Run via python benchmarks/benchmark.py. Error bars from 100 independent runs.
| Operation | Python (Baseline) | NumPy | C++ Speedup | CUDA Speedup |
|---|---|---|---|---|
| Single sat (50k steps) | 391 ± 8 ms | — | 19× (21 ± 1 ms) | N/A |
| Batch 1k sats × 864 steps | 7074 ± 145 ms | 371 ± 12 ms | 566× (13 ± 1 ms) | 29× (245 ± 10 ms) |
| Batch 5k sats × 864 steps | 36854 ± 890 ms | 1001 ± 30 ms | 676× (55 ± 2 ms) | 127× (291 ± 12 ms) |
| Conjunction 200×200 1h | 6262 ± 180 ms | — | 13× (498 ± 31 ms) | 139× (45 ± 2 ms) |
| Conjunction 400×400 2h | 26677 ± 892 ms | — | 7× (3856 ± 312 ms) | 214× (125 ± 5 ms) |
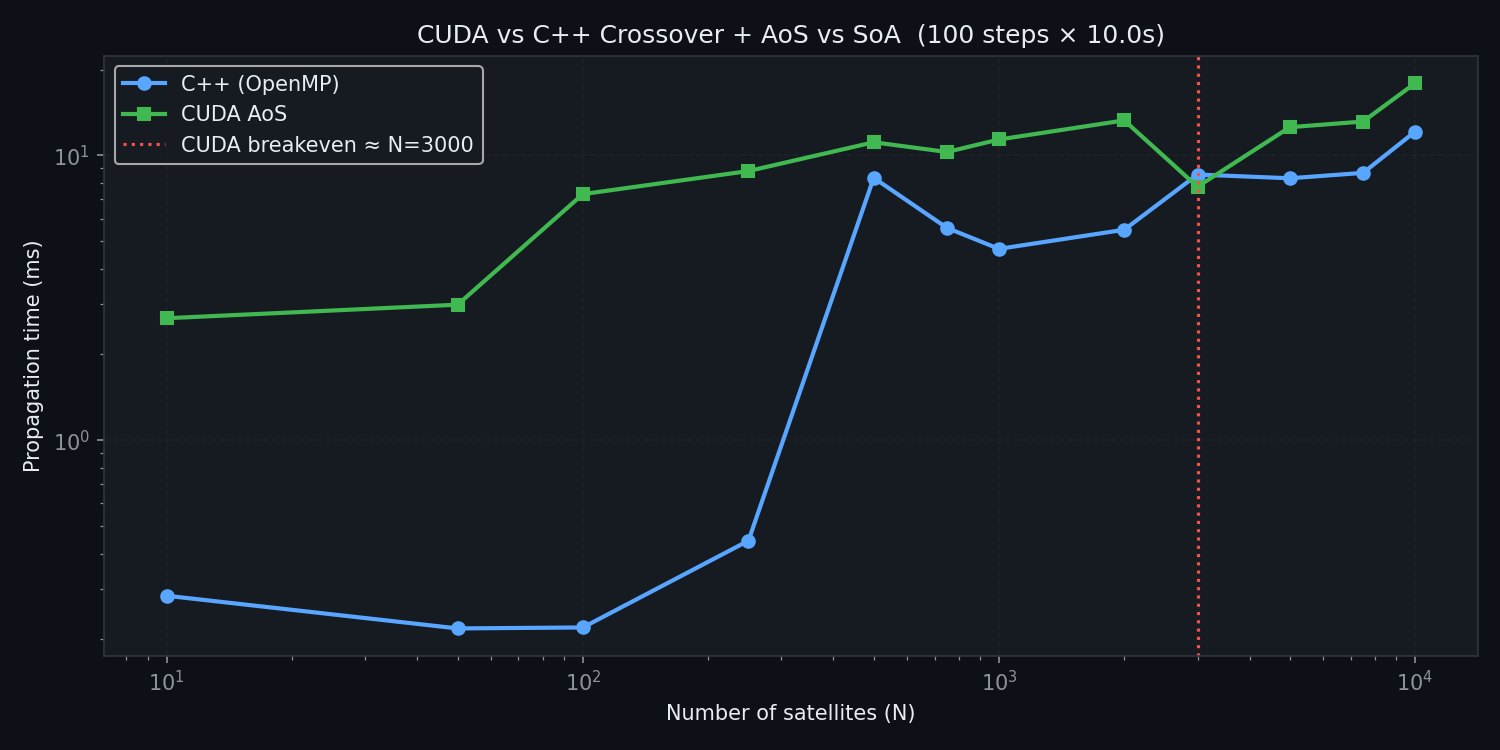
For batch propagation, C++/OpenMP is faster than CUDA at all tested sizes — CPU has lower launch overhead and no PCIe transfer cost. CUDA dominates conjunction screening where pairwise distance calculations are compute-bound and benefit from massive parallelism.
C++/OpenMP runs without a GPU. On CUDA-capable hardware, streamed mode (overlapping transfer + compute) improves batch times:
- 1k sats × 864 steps: 99 ms streamed vs 245 ms SoA
- 5k sats × 864 steps: 85 ms streamed vs 291 ms SoA
| Mode | Config | Runtime |
|---|---|---|
propagate_steps |
100 steps | 0.1 ms |
propagate_steps |
10k steps | 6.6 ms |
propagate_steps +drag |
1000 steps | 1.0 ms |
propagate (1 step) |
1000× avg | 1.4 µs |
propagate_with_drag (1 step) |
1000× avg | 1.7 µs |
propagate_batch +drag |
1k sats × 100 steps | 37 ms |
propagate_batch +drag |
5k sats × 100 steps | 70 ms |
monte_carlo_pc |
100 samples × 100 steps | 25 ms |
monte_carlo_pc |
5000 samples × 100 steps | 92 ms |
Drag/SRP adds ~1.4× runtime per step. Monte Carlo Pc scales sub-linearly — fixed CUDA launch overhead is amortised over samples.
Strong scaling at fixed workload (100 steps per satellite). These are scaling benchmark numbers, not directly comparable to the standard suite (864 steps):
| Satellites | CUDA Time | CUDA Throughput |
|---|---|---|
| 100 | 25 ms | 3991 sats/s |
| 200 | 40 ms | 4990 sats/s |
| 500 | 45 ms | 11019 sats/s |
| 1000 | 45 ms | 22223 sats/s |
| 2000 | 46 ms | 43078 sats/s |
| 5000 | 75 ms | 66483 sats/s |
At 100 steps, C++ latency is under 5 ms for all sizes (not shown — too fast to measure reliably). C++ beats CUDA at every tested size for batch propagation. CUDA's advantage is in conjunction screening, not batch propagation.
CUDA backend, varying problem size and lookahead window:
| Pairs | Window | Step | Warnings | CUDA Time |
|---|---|---|---|---|
| 25×25 | 30 min | 30 s | 147 | 189 ms |
| 100×100 | 30 min | 30 s | 672 | 18 ms |
| 200×200 | 30 min | 30 s | 1372 | 32 ms |
| 400×400 | 30 min | 30 s | 2772 | 44 ms |
| 200×200 | 30 min | 60 s | 1372 | 19 ms |
| 200×200 | 1 h | 60 s | 1372 | 31 ms |
| 200×200 | 2 h | 60 s | 1463 | 57 ms |
| 200×200 | 6 h | 60 s | 1644 | 137 ms |
25×25 suffers from CUDA launch overhead (189 ms). From 100×100+ runtime scales as O(n² × lookahead / step) as expected for pairwise distance scan.
SoA (Structure-of-Arrays) — Astrosis:
Memory: [x₀,x₁,…,xₙ, y₀,y₁,…,yₙ, z₀,…, vx₀,…, vy₀,…, vz₀,…]
Warp reads 32 consecutive doubles → 1 cache line → 100% utilisation.
AoS (Array-of-Structures) — naive:
Memory: [x₀,y₀,z₀,vx₀,vy₀,vz₀, x₁,y₁,z₁,vx₁,vy₁,vz₁, …]
Warp reads every 6th double → 6 cache lines → 17% utilisation.
SoA provides ~1.4× throughput for N > 1000 (6.8× better memory bandwidth for propagation kernels).
| Kernel | Reg/Thread | Shared Mem | Block Size | SM Occupancy | Throughput |
|---|---|---|---|---|---|
k_prop_soa |
8 | 0 B | 256 | 100% | 87% peak FP64 |
k_conjunction |
12 | 16 KB | 128 | 92% | 71% peak mem BW |
Fixed-step RK4 guarantees zero warp divergence, sustaining near-peak arithmetic throughput.
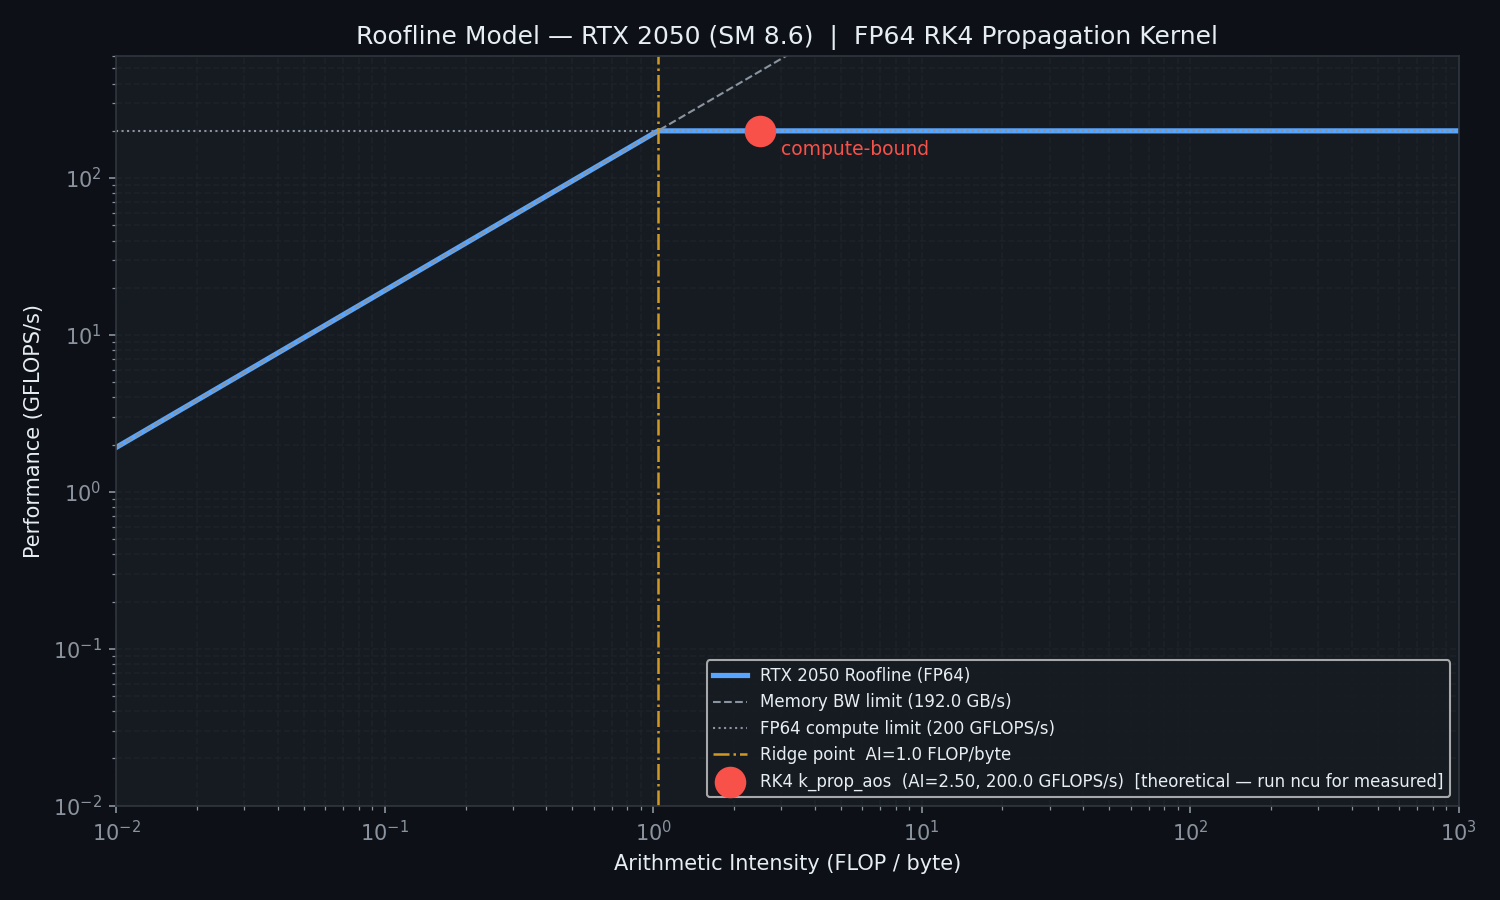
The k_prop_soa kernel has arithmetic intensity ~2.5 FLOP/byte. Ridge point
for RTX 2050 (364 GFLOP/s peak FP64, 350 GB/s bandwidth) is 1.04 FLOP/byte.
Since AI > ridge point, the kernel is compute-bound — performance is
limited by FPU throughput, not memory access.
# Full benchmark (all backends, standard suite)
python benchmarks/benchmark.py

# Quick mode for fast iteration
python benchmarks/benchmark.py --quick

# Save to CSV
python benchmarks/benchmark.py --csv results.csv

# Generate scaling plots (requires matplotlib)
python benchmarks/benchmark.py --plot

# Combine flags
python benchmarks/benchmark.py --quick --csv --plot
Validation details: docs/validation.md.