![]()
Transform your analytics with the Business Intelligence platform—crafted by Volkov Labs for high-performance, scalable, and alert-driven insights in Grafana.
- High-Performance Business Engine: Powers robust analytics with distributed load balancing and high availability, seamlessly integrated with Grafana.
- User-Friendly Business Studio: Simplifies engine management for all users, enabling easy configuration and monitoring of data workflows.
- Advanced Business Alerts: Leverages Grafana panel queries with customizable thresholds and variables for timely, actionable notifications.
Get started with this tutorial:

- Compatible with Grafana 11 (Business Intelligence 2.X).
The Business Intelligence platform uses Docker for modularity and scalability. Follow these steps to set it up:
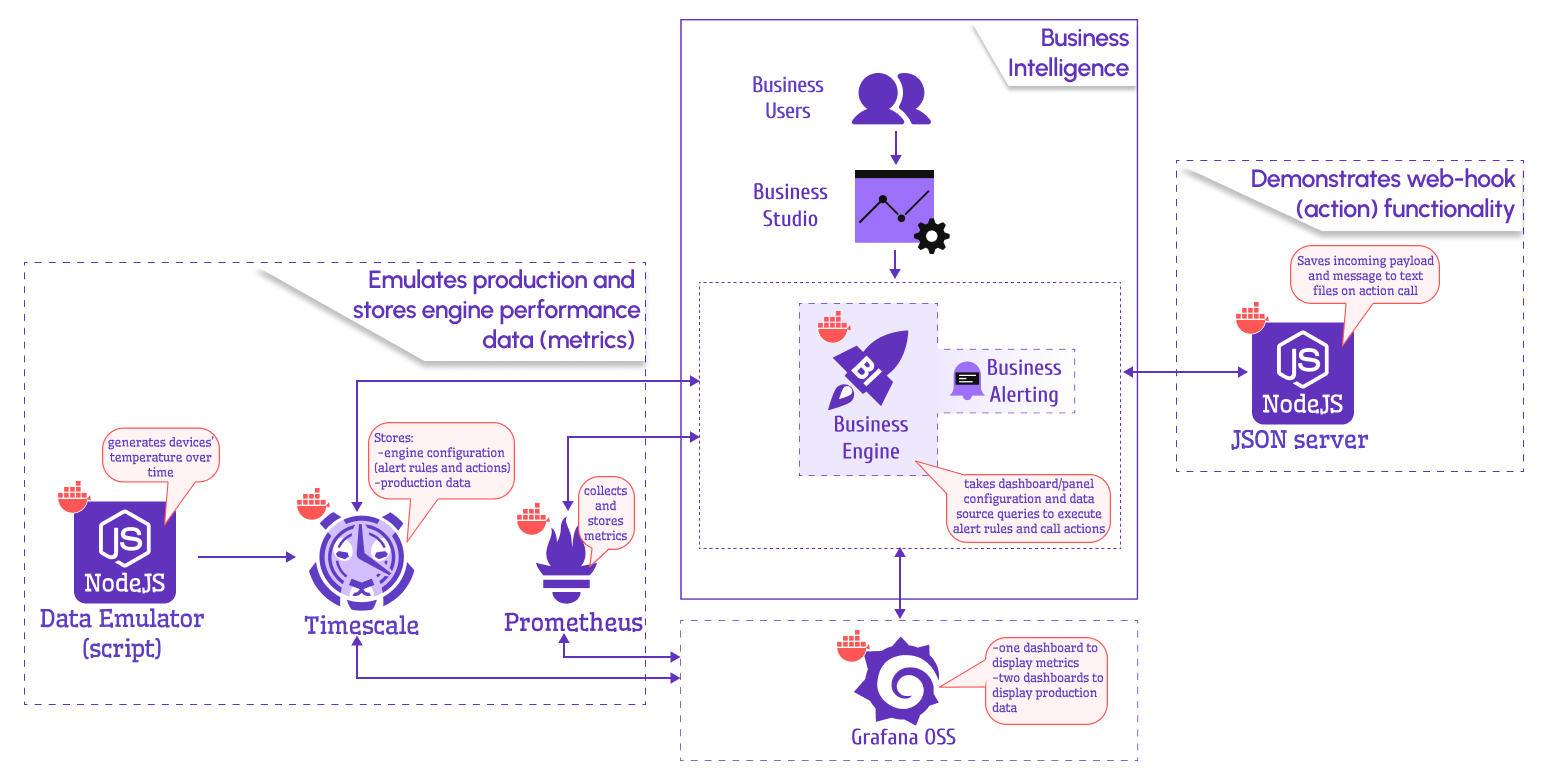
- Start the Grafana container and log in as
admin(password:admin):docker compose --profile grafana up -d
- Create a Service Account in Grafana for API access.
- Launch the Business Engine, Timescale database, and Prometheus:
docker compose --profile engine up -d
- Actions Testing: Start the JSON Server for webhook testing:
docker compose --profile actions up -d
- Data Emulator: Start the emulator for dashboard variables:
docker compose --profile emulator up -d
- Download Business Studio from Releases.
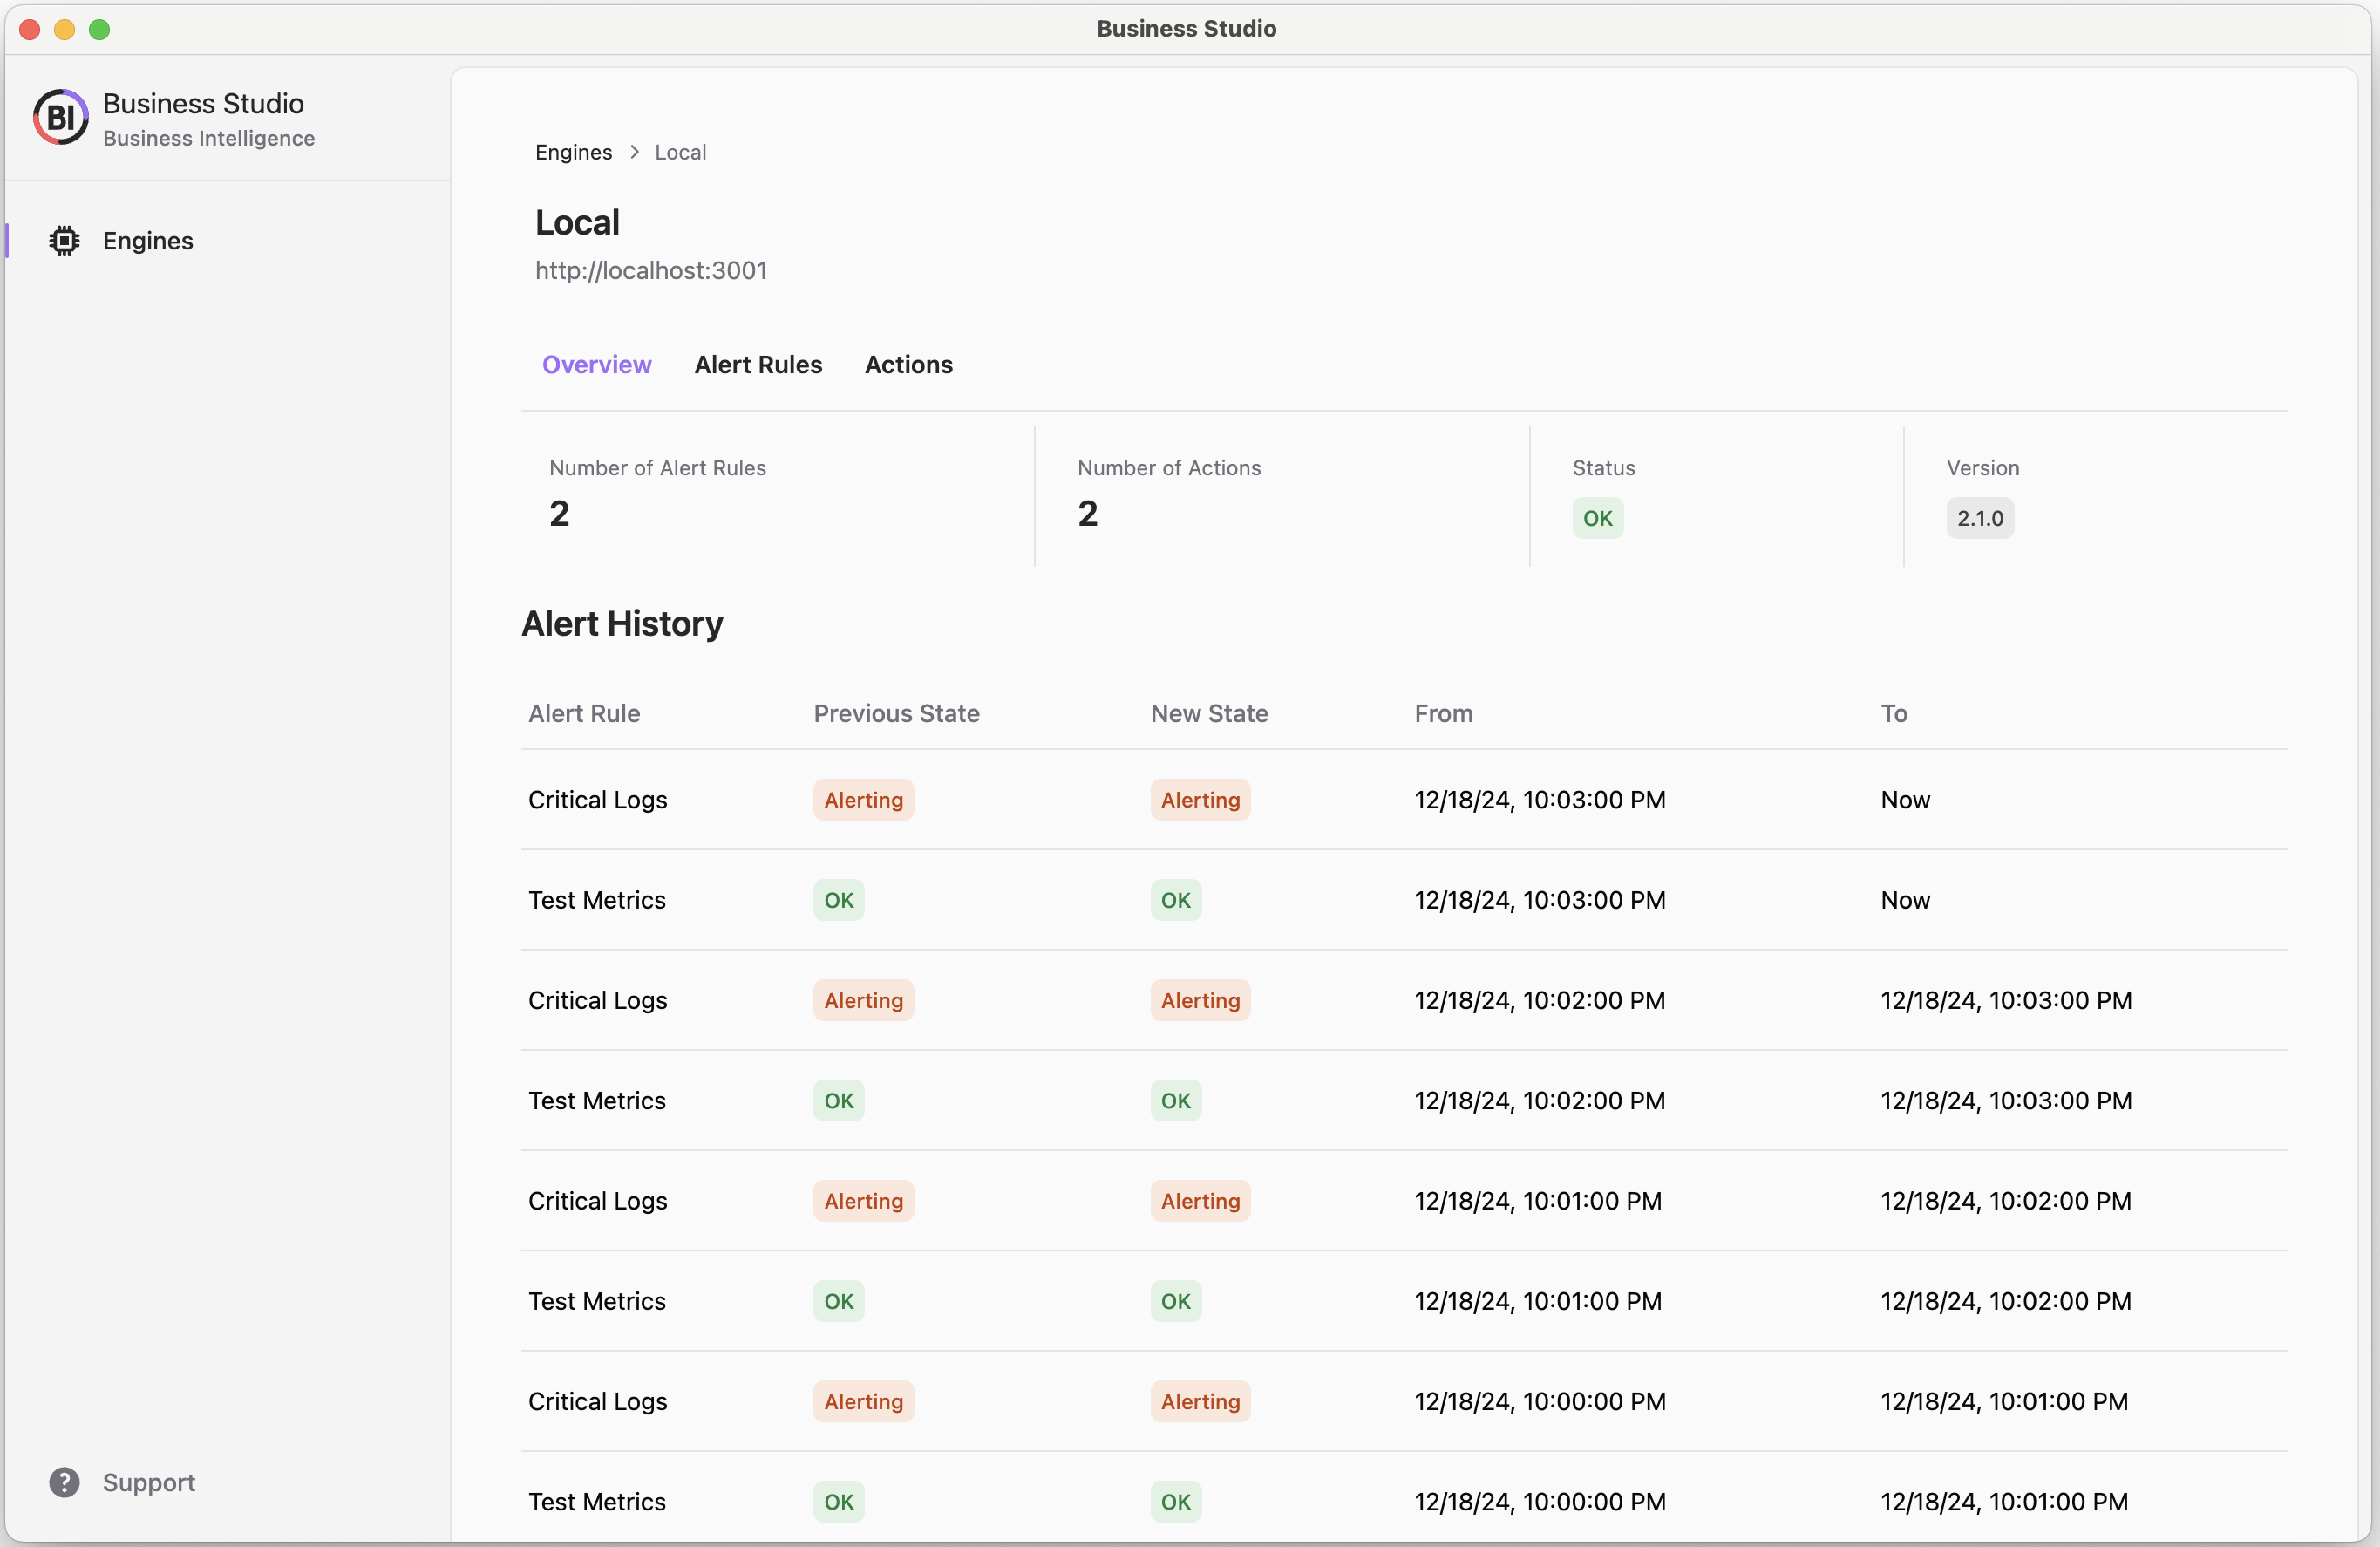
- Open Business Studio and add an Engine.
- Update the Grafana OSS connection in Environment settings or Grafana Cloud:
http://grafana:3000
- Actions: Use
http://json-server:3000(if started) for HTTP actions to log events/messages. - Alert Rules:
- Base rules on the provisioned
Test Dashboardusing thresholds or regex patterns. - Use the
Metricsdashboard for variable-based rules with threshold overrides.
- Base rules on the provisioned
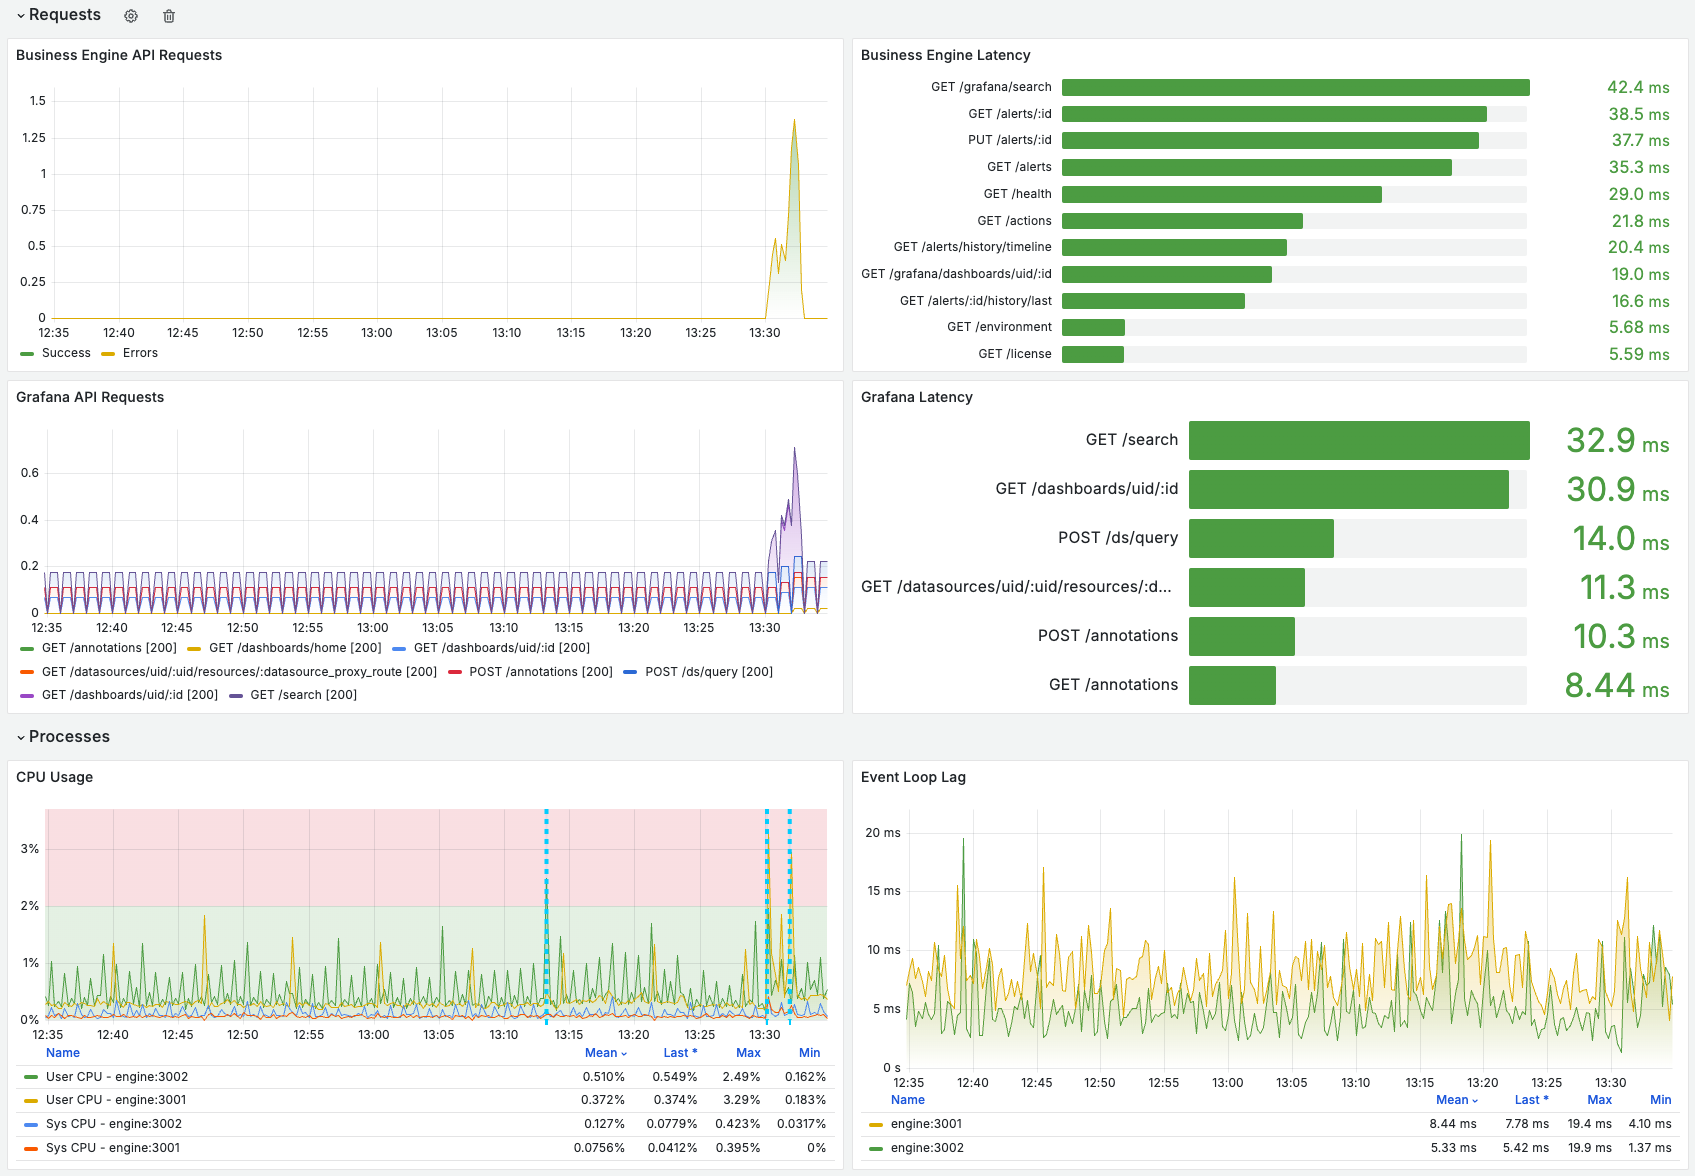
- View performance metrics in the provisioned
Business Enginedashboard:
- Stop all components:
docker compose --profile grafana down
docker compose --profile engine down
docker compose --profile actions down
docker compose --profile emulator down
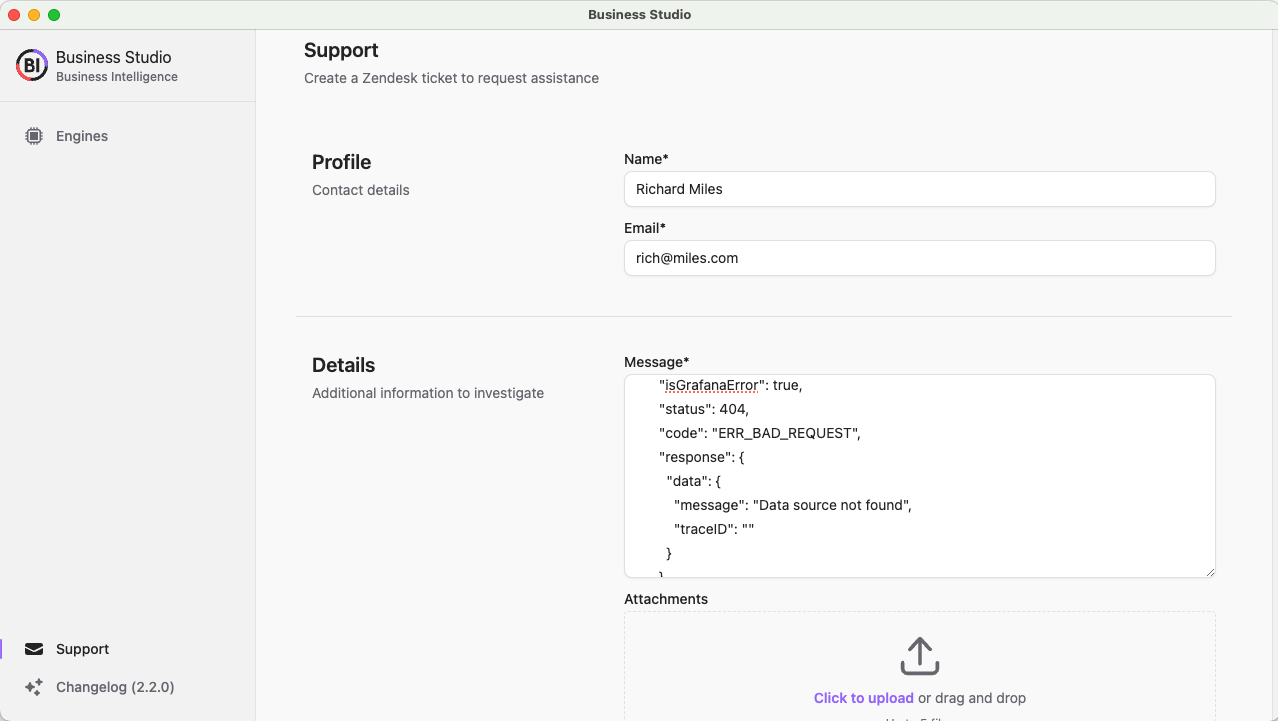
Need help? Request assistance directly in Business Studio:
- GitHub Issues: Ask questions, suggest features, or report bugs at github.com/volkovlabs/business-intelligence/issues.
- YouTube: Subscribe to youtube.com/@volkovlabs and share your feedback in the comments.
- Business Suite Enterprise: Open Zendesk tickets via our Support Portal.
We’re excited to hear from you!