
Apple Silicon GPU/CPU/Memory monitoring CLI — like gpustat, but for Metal.
No sudo required. Uses IOReport private API for GPU/power metrics.
pip install metalstatOr with uv:
uv tool install metalstat# One-shot: all metrics + top processes
metalstat -a -p
# Watch mode: refresh every 1s
metalstat -a -i 1
# See all options
metalstat --helpWrap any command with metalstat run to log system metrics while it executes:
metalstat run -o myexp --capture -- ./my_inference --model foo.ggufThree files land under the -o prefix:
myexp.meta.json— static info (hostname, chip, total memory)myexp.jsonl— per-tick metric samples, streamed while the child runsmyexp.log— child stdout+stderr (only with--capture)
Use the same prefix your experiment uses for its own artifacts and everything
pairs up on disk. metalstat forwards SIGINT/SIGTERM to the child and exits
with the child's exit code.
For ad-hoc composition, three lower-level flags emit JSON directly:
metalstat --jsonl                      # one sample, then exit
metalstat --jsonl -i 1 > run.jsonl     # stream to stdout
metalstat --meta-json > run.meta.json  # static info only
--jsonl always collects CPU, GPU, and power regardless of other flags, so
the schema stays uniform across runs. Each sample line is a flat object:
| field | meaning |
|---|---|
t |
wall-clock time (unix seconds, float) |
elapsed_s |
seconds since first sample in this stream |
gpu_util, gpu_freq_mhz |
GPU utilization (0-100) and frequency |
cpu_util, cpu_p_util, cpu_e_util |
total / P-cluster / E-cluster utilization |
mem_used_gb, mem_wired_gb, mem_active_gb, mem_inactive_gb, mem_compressed_gb |
memory breakdown (GiB, labeled _gb) |
mem_pressure_pct, mem_pressure_level |
memory pressure (green / yellow / red) |
gpu_mem_allocated_gb |
Metal GPU memory currently allocated |
swap_used_gb |
swap in use |
cpu_w, gpu_w, ane_w, dram_w, pkg_w |
power draw per rail (watts) |
All numeric fields are null when unavailable. Every line has the same keys,
so it loads directly into pandas:
import pandas as pd
df = pd.read_json("run.jsonl", lines=True)
df.plot(x="elapsed_s", y=["gpu_util", "cpu_util"])
Sizes suffixed _gb are GiB (1024³ bytes), matching what the formatted view
displays.
Apple Silicon uses Unified Memory Architecture (UMA) — the CPU and GPU share a single pool of RAM. There is no separate VRAM. This is fundamentally different from NVIDIA/CUDA where the GPU has its own dedicated memory (e.g. 24GB VRAM on an RTX 4090) and data must be copied between CPU and GPU over PCIe.
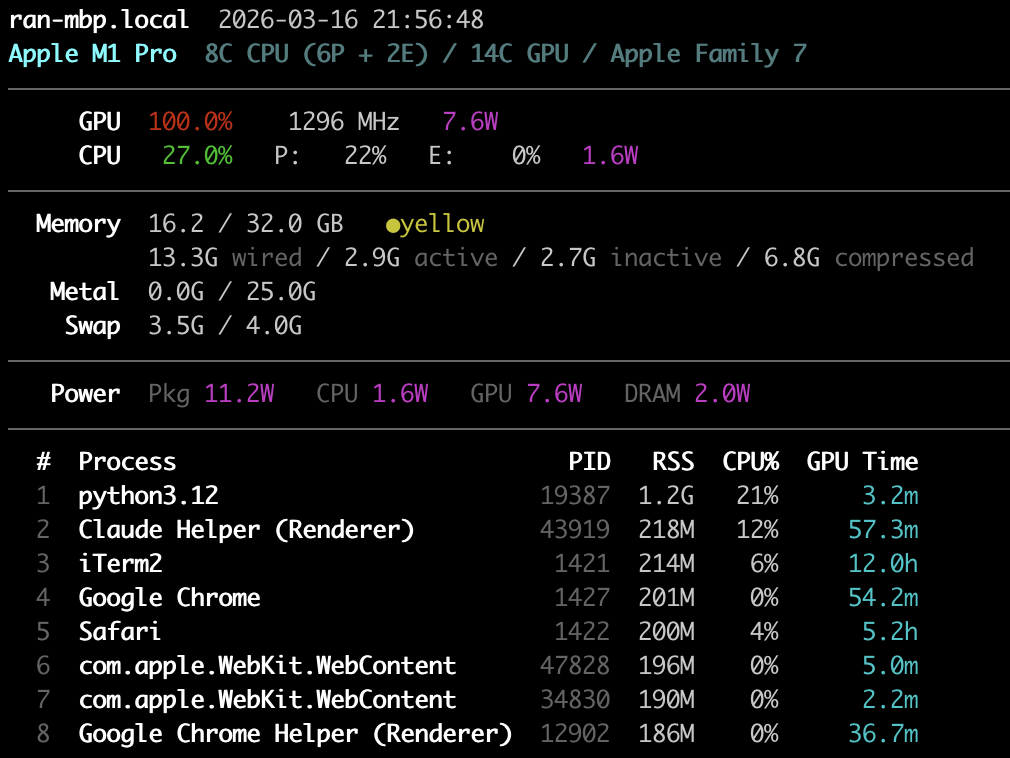
  Memory  15.6 / 32.0 GB   ●green                    ← system memory (shared by CPU + GPU)
          2.7G wired / 12.9G active / ...             ← breakdown by page state
   Metal  3.4G / 25.0G                                ← GPU memory in use / recommended max
System memory (15.6 / 32.0 GB) is the total unified memory usage — CPU and
GPU workloads combined. The breakdown shows:
- Wired: Locked by the kernel, cannot be paged out or compressed
- Active: Recently used pages
- Inactive: Not recently accessed, still in RAM, reclaimable
- Compressed: macOS compresses inactive pages in-memory before swapping to disk
Metal GPU memory (3.4G / 25.0G) shows how much system memory is
currently in use by GPU resources (textures, buffers, ML model weights) across
all processes vs. the recommended maximum. The in-use value is read
system-wide from the IOAccelerator IORegistry node — MTLDevice's own
currentAllocatedSize is per-process and would only see this tool's own
(empty) device. This is the closest equivalent to "VRAM used / VRAM total" on
NVIDIA, but with important differences:
| NVIDIA (CUDA) | Apple Silicon (Metal) | |
|---|---|---|
| GPU memory pool | Dedicated VRAM (fixed) | Shared with CPU (unified) |
| "Total" | Physical VRAM size | recommendedMaxWorkingSetSize (~75% of RAM) |
| Hard limit? | Yes — allocation fails at VRAM cap | No — soft limit, but going over causes swap thrashing |
| Zero-copy CPU↔GPU? | No, must cudaMemcpy |
Yes, CPU and GPU see the same physical pages |
The recommended max (~75% of RAM) is not a hardware limit — Metal will let you allocate beyond it. But exceeding it forces the OS to compress or swap out other memory, degrading performance. This is why a 192GB Mac can load LLMs that would need multiple 80GB A100s: the GPU directly accesses main memory with no copy overhead, but you're sharing that memory budget with the rest of the system.
Pressure (●green / ●yellow / ●red) shows system-wide memory pressure:
- Green (>50% free): Healthy, plenty of headroom
- Yellow (25-50% free): Moderate pressure, compression active
- Red (<25% free): Heavy pressure, swapping likely
- macOS on Apple Silicon (M1/M2/M3/M4)
- Python 3.9+
MIT