02. ADΔER (Address, D, Δt Event Representation)
To address these concerns, I propose the ADΔER (pronounced "adder") representation is inspired by the ASINT camera design by Singh et al. It aims to help us move away from thinking about video in terms of fixed sample rates and frames, and to provide a one-size-fits-all ("narrow waist") method for representing intensity information asynchronously.
Under the ASINT model, a pixel
Practically speaking, it's most useful to think about ADΔER in reference to the source data type. In the context of framed video, ADΔER allows us to have multi-frame intensity averaging for stable (unchanging) regions of a scene. This can function both to denoise the video and enable higher dynamic range, all while preserving the temporal synchronicity of the source. In the context of event video (like that of a DVS camera), ADΔER unlocks the potential for lossy compression, since ADΔER events represent independent intensity measurements, rather than relative intensity change measurements.
Let's visualize the differences between the different pixel models we're talking about. Imagine that light is actually rainfall, and our camera is a weather station. A pixel in this analogy is a bucket to capture the rainfall in some way and measure it.
On the left, we have a framed pixel model. Here, we let our bucket fill up with water for a fixed amount of time (5 time units). Once that time is up, we record the absolute measurement of how much water is in the bucket (4.5 liters). We empty the bucket, and let it fill up with with rain water for another 5 time units.
In the middle, we have a DVS event pixel model. Here, our bucket is continuously measuring the rate of rainfall. At the exact moment that we detect that the rate has changed, we record that time (9 units) and the polarity of the change (negative, in this case).
On the right, we have an ADΔER pixel model. Here, we let our bucket fill up with water until it reaches a certain fill point threshold (4 liters). At the moment the bucket fills up to that level, we record how much time has passed since we last filled the bucket (4 units, then 3) and what the threshold is (D = 2).
To give a clearer picture of what's going on, let's visualize how we may represent a changing light intensity impulse under these three models.

On the left, we see how a framed model will record the amount of light integrated at fixed-length intervals.
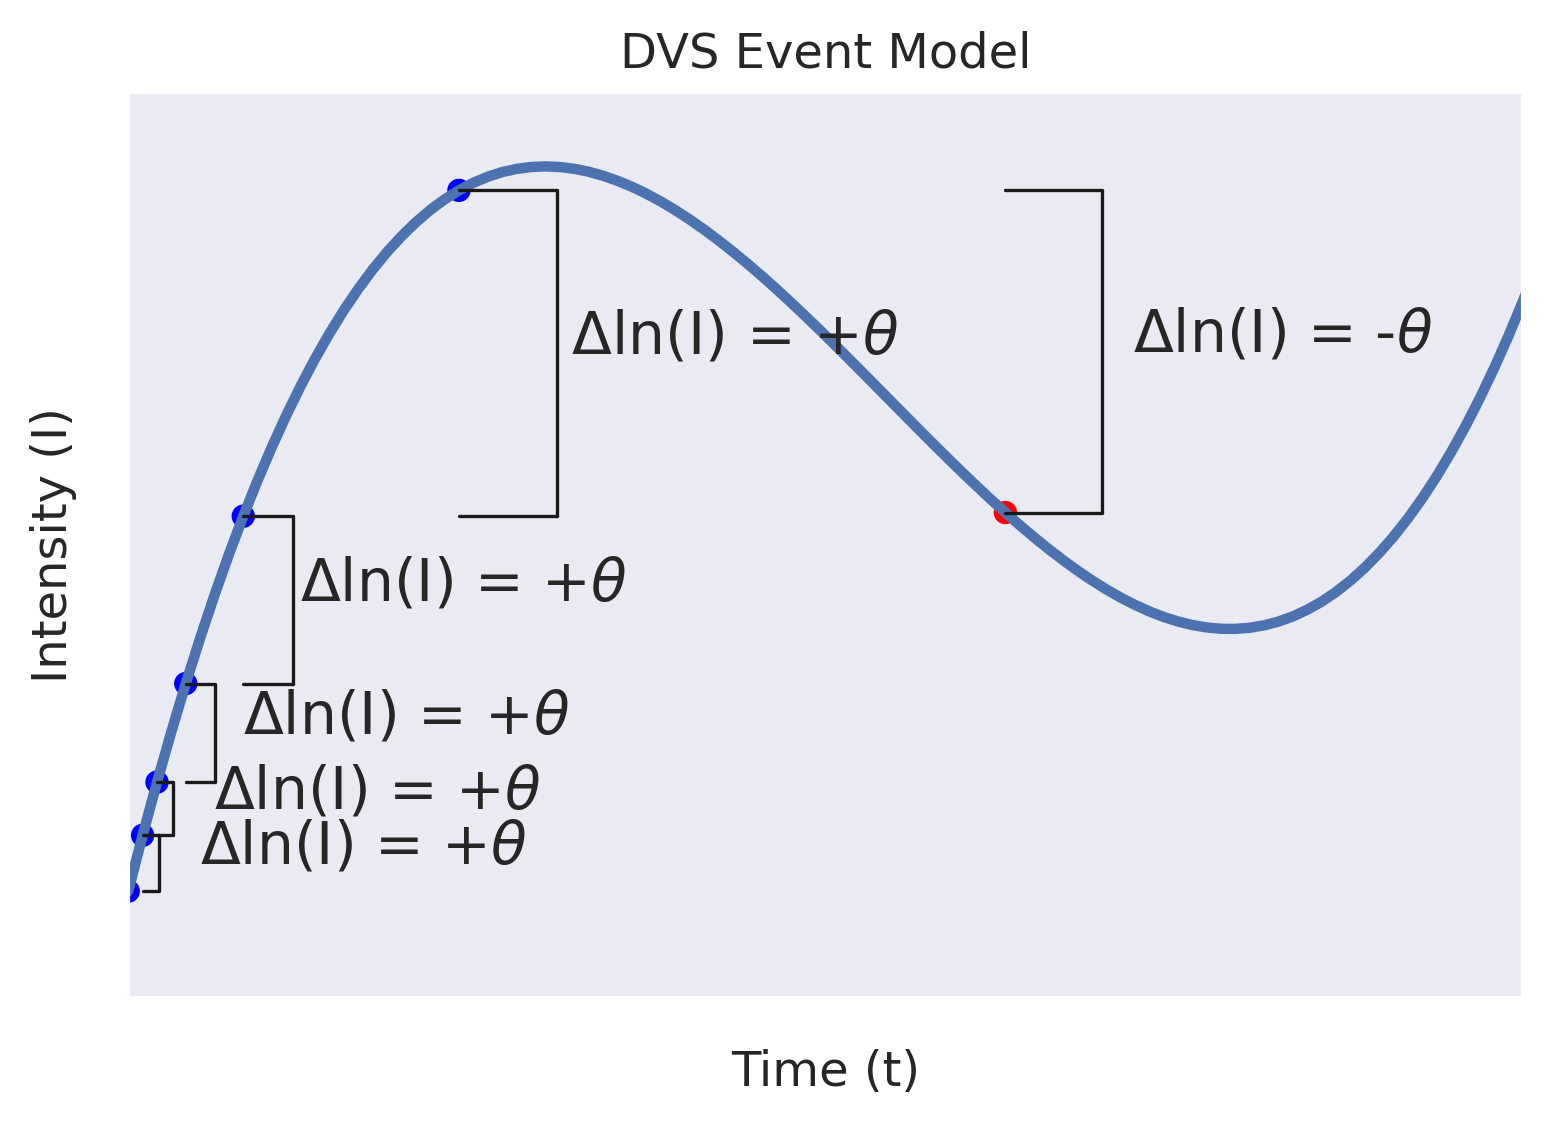
In the middle, we see how a DVS model tracks the times that there are changes in the log intensity across a threshold, θ. Note how every event is expressing change relative to a previous event's measurement.
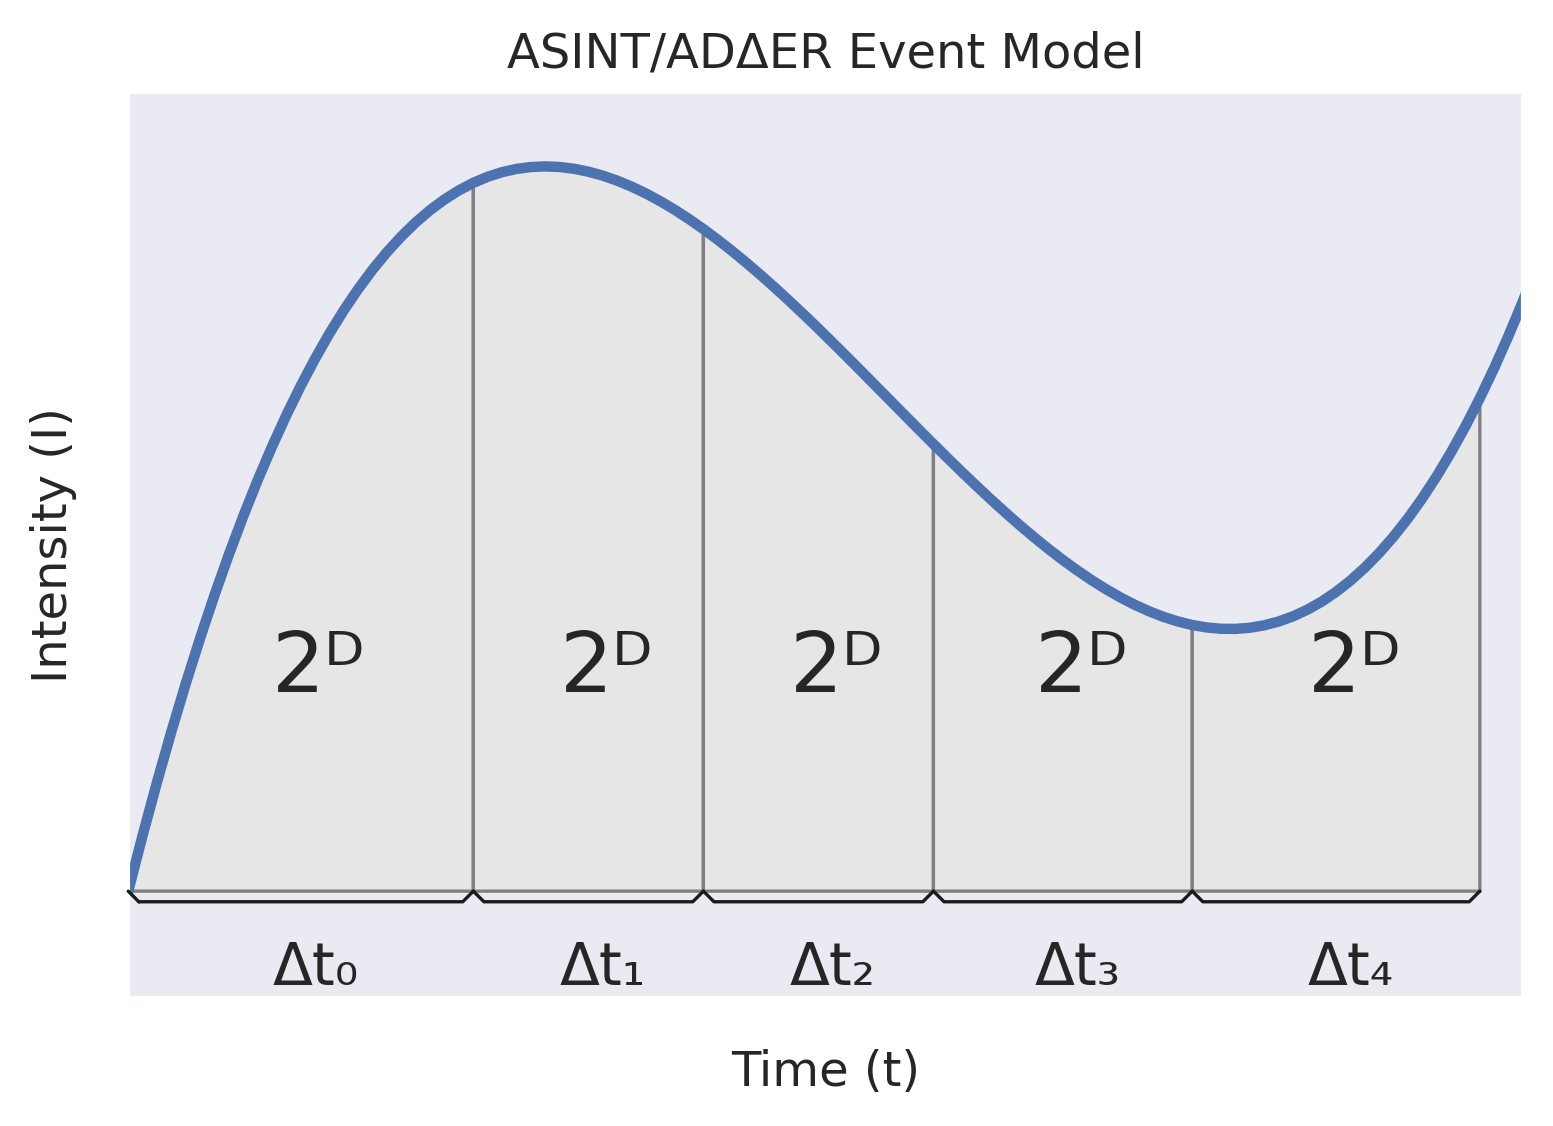
On the right, we see how the ADΔER model measures the amount of time required to integrate a given amount of light. In this example, D is fixed. When the incoming light intensity decreases, Δt increases. When the incoming light intensity increases, Δt decreases. In practice, we can dynamically adjust D to maintain a desired event rate.