Track your AI coding assistant usage across Claude Code, Cline, Codex CLI, and more—with realtime monitoring, cost analytics, and beautiful terminal dashboards.

AI coding assistants are incredibly powerful, but costs can add up quickly. This tool gives you complete visibility into your usage patterns across 9 different AI tools, helping you:
- 💰 Optimize spending - See exactly where your tokens go
- 📊 Track trends - Month-over-month comparisons and projections
- 🎯 Stay within limits - Real-time monitoring with P90 limit detection
- 🔒 Keep data local - Everything runs offline, no data leaves your machine
- 🎨 Beautiful dashboards - Rich terminal UI with progress bars and tables
Works with: Claude Code, Cline, Codex CLI, Gemini CLI, Roo Code, Kilo Code, GitHub Copilot, OpenCode, Pi Agent
- Why This Exists
- Key Features
- Supported AI Tools
- Installation
- Quick Start
- Usage
- MCP Server Integration
- Subscription Plans & Savings
- Development
- Troubleshooting
- Community
- License
- Contributing
- Export to JSON/CSV - Export usage data for analysis in Excel, Python, or other tools
- 50%+ Faster Monitoring - Incremental file loading for improved performance
- Optional Telemetry - Opt-in Logfire integration for observability (privacy-first)
- Multi-Tool Monitoring - Support for 9 AI coding tools (Claude Code, Codex CLI, Gemini CLI, Cline, Roo Code, Kilo Code, GitHub Copilot, OpenCode, Pi Agent)
- Subscription Savings - Calculate and display how much you save with subscription plans vs API pricing
- Month-over-Month Comparison - Track usage trends with delta calculations
- Date Range Filtering - Filter reports by custom date ranges (
--from-date,--to-date) - MCP Server - Integrate with AI assistants via Model Context Protocol
- TOML Configuration - Configure settings via
~/.ai-usage-monitor.toml - Real-time Monitoring - Configurable refresh rates (0.1-20 Hz)
- Rich Terminal UI - Beautiful color-coded progress bars and tables
- P90 Analysis - Machine learning-based limit detection
- Cost Analytics - Model-specific pricing with cache token calculations
| Tool | Data Format | Default Path |
|---|---|---|
| Claude Code | JSONL | ~/.claude/projects/ |
| Codex CLI | JSONL | ~/.codex/sessions/ |
| Gemini CLI | JSON | ~/.gemini/ |
| Cline | JSON | VS Code globalStorage |
| Roo Code | SQLite | VS Code globalStorage |
| Kilo Code | JSON | ~/.vscode/globalStorage/kilocode.kilo-code/ |
| GitHub Copilot | SQLite | VS Code workspaceStorage |
| OpenCode | JSON/TXT | ~/.local/share/opencode/ |
| Pi Agent | JSONL | ~/.pi/agent/sessions/ |
# Install from PyPI
uv tool install ai-usage-monitor

# Run from anywhere
ai-usage-monitorpip install ai-usage-monitor
# If command not found, add ~/.local/bin to PATH:
echo 'export PATH="$HOME/.local/bin:$PATH"' >> ~/.bashrc
source ~/.bashrc
ai-usage-monitorpipx install ai-usage-monitor
ai-usage-monitorgit clone https://github.com/aecs4u/ai-usage-monitor.git
cd ai-usage-monitor
uv tool install .# Monthly usage report (default - great for quick check)
ai-usage-monitor
# Monthly report with subscription savings (Max5 plan)
ai-usage-monitor --plan max5
# Real-time monitoring
ai-usage-monitor --view realtime
# Daily usage report
ai-usage-monitor --view daily
# Monitor specific tool
ai-usage-monitor --tool codex-cli
# Filter by date range
ai-usage-monitor --view daily --from-date 2025-01-01 --to-date 2025-01-15The tool can be invoked using any of these commands:
ai-usage-monitor(primary)usage-monitor(short)um(shortest)
| Option | Type | Default | Description |
|---|---|---|---|
--tool |
string | auto | Tool to monitor: auto, all, claude-code, codex-cli, gemini-cli, cline, roo-code, kilo-code, github-copilot, opencode, pi-agent |
--plan |
string | custom | Plan type: pro, max5, max20, custom |
--view |
string | monthly | View mode: realtime, daily, monthly |
--from-date |
string | None | Start date filter (YYYY-MM-DD) |
--to-date |
string | None | End date filter (YYYY-MM-DD) |
--export |
string | None | Export format: json, csv |
--export-path |
string | stdout | Output file path for export |
--timezone |
string | auto | Timezone (auto-detected) |
--theme |
string | auto | Display theme: light, dark, classic, auto |
--refresh-rate |
int | 10 | Data refresh rate in seconds (1-60) |
--custom-limit-tokens |
int | None | Token limit for custom plan |
--version, -v |
flag | - | Show version information |
--clear |
flag | - | Clear saved configuration |
Summary report with monthly aggregated usage data and subscription savings analysis. Great for quick checks of your overall usage.
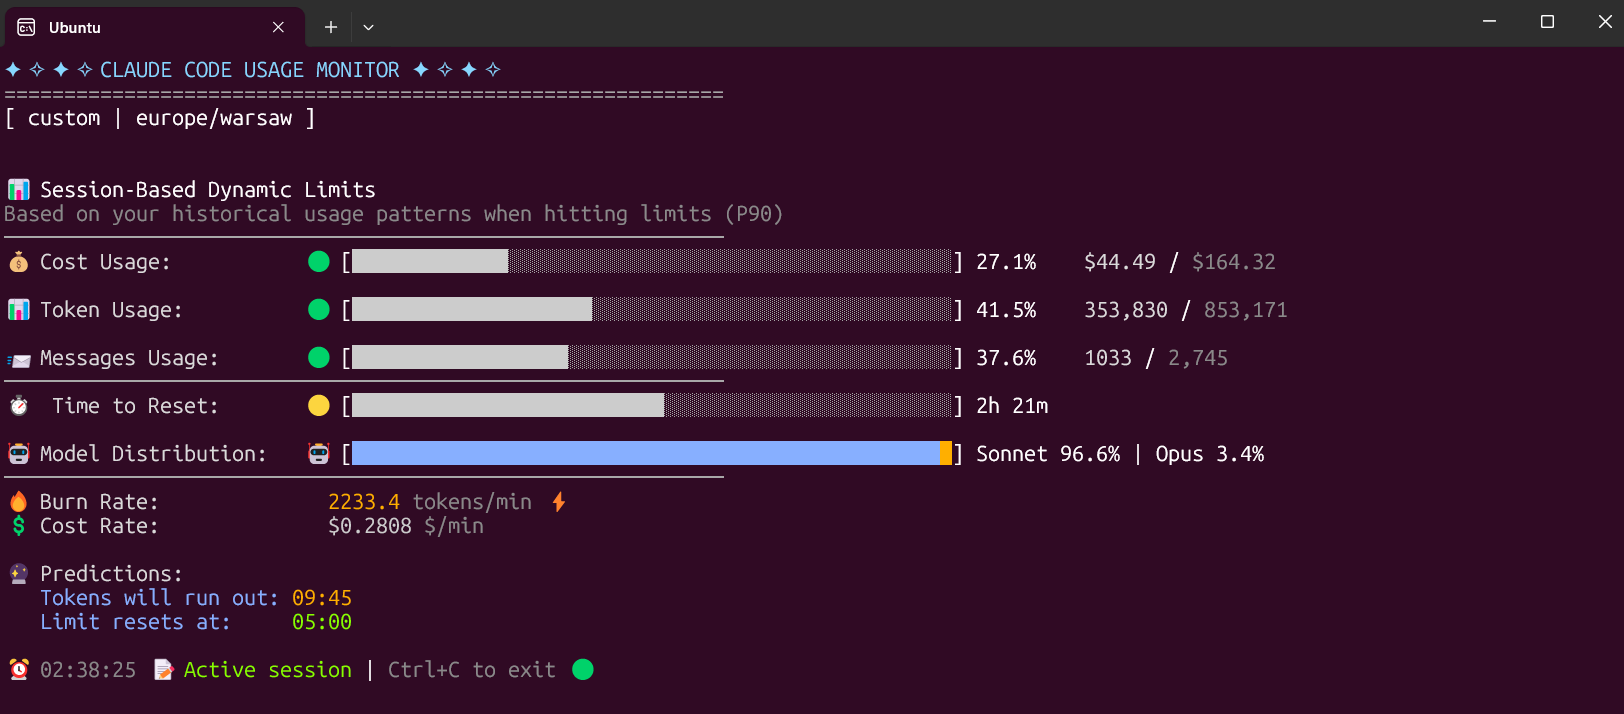
Live monitoring with progress bars, current session data, and burn rate analysis.
ai-usage-monitor --view realtimeAggregated daily statistics with token breakdown and costs.
ai-usage-monitor --view daily --plan max5Output includes:
- Daily token usage table
- Summary with total tokens and API-equivalent cost
- Subscription savings calculations (for Pro/Max5/Max20 plans)
- Data range indicator
Monthly aggregated data with month-over-month comparison.
ai-usage-monitor --view monthly --plan max5Output includes:
- Monthly usage table
- Month-over-month comparison with deltas
- Subscription savings per month
- Overall trend analysis
Filter reports to specific date ranges:
# View January 2025 only
ai-usage-monitor --view daily --from-date 2025-01-01 --to-date 2025-01-31

# Last week
ai-usage-monitor --view daily --from-date 2025-01-16

# December 2024 monthly report
ai-usage-monitor --view monthly --from-date 2024-12-01 --to-date 2024-12-31
Export your usage data to JSON or CSV for further analysis:
# Export to JSON file
ai-usage-monitor --view daily --export json --export-path daily_usage.json

# Export to CSV file
ai-usage-monitor --view monthly --export csv --export-path monthly_usage.csv

# Export to stdout (pipe to other tools)
ai-usage-monitor --view daily --export json | jq '.data[] | select(.total_cost > 1.0)'

# Export multi-tool aggregation
ai-usage-monitor --tool all --view monthly --export csv --export-path all_tools.csv

# Export with date filtering
ai-usage-monitor --view daily --from-date 2025-01-01 --export json --export-path january.json
Export formats:
- JSON: Includes metadata (version, export timestamp, tool name) and structured data
- CSV: Simple tabular format, easy to import into Excel/Google Sheets
JSON export structure:
{
  "format": "ai-usage-monitor-export",
  "version": "1.0",
  "view_type": "daily",
  "tool": "claude-code",
  "exported_at": "2025-01-24T12:00:00+00:00",
  "data": [
    {
      "date": "2025-01-20",
      "input_tokens": 1000,
      "output_tokens": 500,
      "total_cost": 0.05,
      ...
    }
  ]
}Create ~/.ai-usage-monitor.toml for persistent settings:
[general]
default_tool = "auto"
theme = "dark"
timezone = "America/New_York"
time_format = "12h"
refresh_rate = 10
plan = "max5"
view = "realtime"

[tools.claude-code]
enabled = true
data_path = "~/.claude/projects"

[tools.codex-cli]
enabled = true

[tools.cline]
enabled = false

[cloud]
url = ""
api_key = ""
auto_upload = falseAI Usage Monitor includes an MCP (Model Context Protocol) server for integration with AI assistants.
| Tool | Description |
|---|---|
get_daily_stats |
Get daily usage statistics |
get_model_usage |
Get usage breakdown by model |
get_cost_breakdown |
Get cost analysis by period |
compare_tools |
Compare usage across different tools |
list_available_tools |
List all available AI tools |
Add to your Claude Desktop configuration:
{
  "mcpServers": {
    "ai-usage-monitor": {
      "command": "ai-usage-monitor-mcp",
      "args": []
    }
  }
}The monitor tracks your API-equivalent usage and calculates savings for subscription plans.
| Plan | Token Limit | Monthly Price | Best For |
|---|---|---|---|
| Pro | 19,000 | $20/mo | Light usage |
| Max5 | 88,000 | $100/mo | Regular development |
| Max20 | 220,000 | $200/mo | Heavy usage |
| Custom | P90-based | API pricing | Pay-as-you-go |
When using --plan max5 or --plan max20, the summary shows:
SUBSCRIPTION SAVINGS (MAX5 Plan)
   Subscription Cost: $200.00 (2 mo x $100)
   You Saved: $1,675.88 (89.3%)
The "Cost*" column in tables shows API-equivalent pricing, not your actual charges.
git clone https://github.com/aecs4u/ai-usage-monitor.git
cd ai-usage-monitor

# Install in development mode
pip install -e ".[dev]"

# Run tests
pytest src/tests/ -v

# Run with coverage
pytest --cov=ai_usage_monitor --cov-report=htmlsrc/ai_usage_monitor/
├── adapters/ # Tool-specific adapters (9 tools)
├── cli/ # CLI entry point and bootstrap
├── core/ # Models, settings, plans, pricing
├── data/ # Data reading and aggregation
├── mcp/ # MCP server implementation
├── monitoring/ # Real-time session monitoring
├── terminal/ # Terminal management and themes
├── ui/ # Display components and layouts
└── utils/ # Formatting, time utilities
- Ensure the AI tool has been used and created usage data
- Check the default data path exists (e.g.,
~/.claude/projects/) - Try specifying the tool explicitly:
--tool claude-code
Add ~/.local/bin to your PATH:
echo 'export PATH="$HOME/.local/bin:$PATH"' >> ~/.bashrc
source ~/.bashrcUse a virtual environment or uv/pipx instead of system pip:
uv tool install ai-usage-monitorForce a specific theme if auto-detection fails:
ai-usage-monitor --theme darkIf upgrading from the old claude-monitor package:
-
Uninstall the old package:
pip uninstall claude-monitor
-
Install the new package:
pip install ai-usage-monitor
-
Update your shell aliases:
# Old: claude-monitor, cmonitor, ccmonitor
# New: ai-usage-monitor, usage-monitor, um
-
Configuration is automatically migrated from
~/.claude-monitor/to~/.ai-usage-monitor/
We'd love to hear from you! Here's how to get involved:
- 💬 Discussions - Ask questions, share usage tips, request features
- 🐛 Issues - Report bugs, track feature requests
- 🌟 Good First Issues - Start contributing to the project
- 📖 Contributing Guide - Learn how to help improve the project
Star this repo ⭐ if you find it useful! It helps others discover the project.
MIT License - feel free to use and modify as needed.
Contributions are welcome! Please see CONTRIBUTING.md for guidelines.
Looking to contribute? Check out issues labeled good first issue or help wanted.
Originally forked from Maciek-roboblog/Claude-Code-Usage-Monitor.
Star this repo if you find it useful!