![]()


A Python implementation of an SN-Graph skeletonisation algorithm. Based on the article SN-Graph: a Minimalist 3D Object Representation for Classification arXiv:2105.14784.

Given a binary image/volume representing a shape, SN-Graph works by:
- Creating vertices as centres of spheres inscribed in the shape, where one balances the size of the spheres with their coverage of the shape, and pariwise distances from one another.
- Adding edges between the neighbouring spheres, subject to a few common-sense criteria.
The resulting graph serves as a lightweight 1-dimensional representation of the original image, potentially useful for further analysis.
For documentation see docs.
For API reference see api_reference.
pip install sn-graphor
poetry add sn-graphSee notebooks demo_sn-graph and 3d_demo for 2D and 3D demo, respectively. Notebook mnist_classification has some good stuff too!
import numpy as np
import sn_graph as sn

# Create a simple square image
img = np.zeros((256, 256))
img[20:236, 20:236] = 1  # Create a square region

# Generate the SN graph
centers, edges, sdf_array = sn.create_sn_graph(
    img,
    max_num_vertices=15,
    minimal_sphere_radius=1.0,
    return_sdf=True
)

import matplotlib.pyplot as plt

#Draw graph on top of the image and plot it
graph_image=sn.draw_sn_graph(centers, edges, sdf_array, background_image=img)

plt.imshow(graph_image)
plt.show()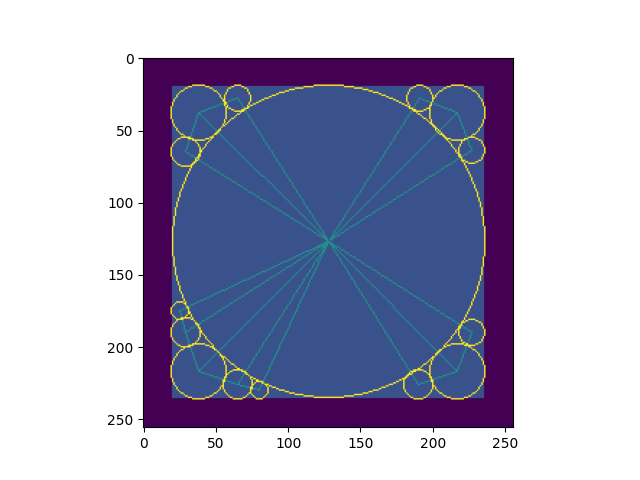
max_num_vertices: Maximum number of vertices in the graphmax_edge_length: Maximum allowed edge lengthedge_threshold: Threshold for determining what portion of an edge must be contained within the shapeminimal_sphere_radius: Minimum radius allowed for spheresedge_sphere_threshold: Threshold value for deciding how close can an edge be to non-enpdpoint spheresreturn_sdf: Whether to return signed distance field array computed by the algorithm (neccessary to extract radii of spheres)
- Tomasz Prytuła ([email protected])