



This project is not endorsed by, directly affiliated with, maintained, authorized, or sponsored by 4-noks / Astrel Group
HA Custom Component to integrate data from 4-noks Elios4you products. Tested personally on my Elios4you Pro to monitor tha main 3-phase 6kw line, plus my 7.5kW photovoltaic system.

Elio4you is a great product, it provides very reliable measurements, but it has no documented local API to get the energy data. Luckily, 3y ago I found this great article by Davide Vertuani, that reversed-engineered how the official mobile app communicated with the device to fetch data, and found out it's a tcp connection on port 5001, through which the app sent specific commands to which the device replies with data. That was a great find by Davide, and I initially used Node-RED to create a quick integration like Davide suggested in the article: I completed a full integration in 1 day and was rock solid, Node-RED is fantastic. :)

One month ago I decided to port the Node-RED integration to an HA Custom Component, because in the last 2 years I developed my first HA component to monitor ABB/FIMER inverters, and now I'm quite knowledgable on custom component developement (learned a lot thanks to the dev community and studying some excellent integrations).
So finally here we are with the first official version of the HA custom integration for Elios4you devices. :)
- Installation/Configuration through Config Flow UI
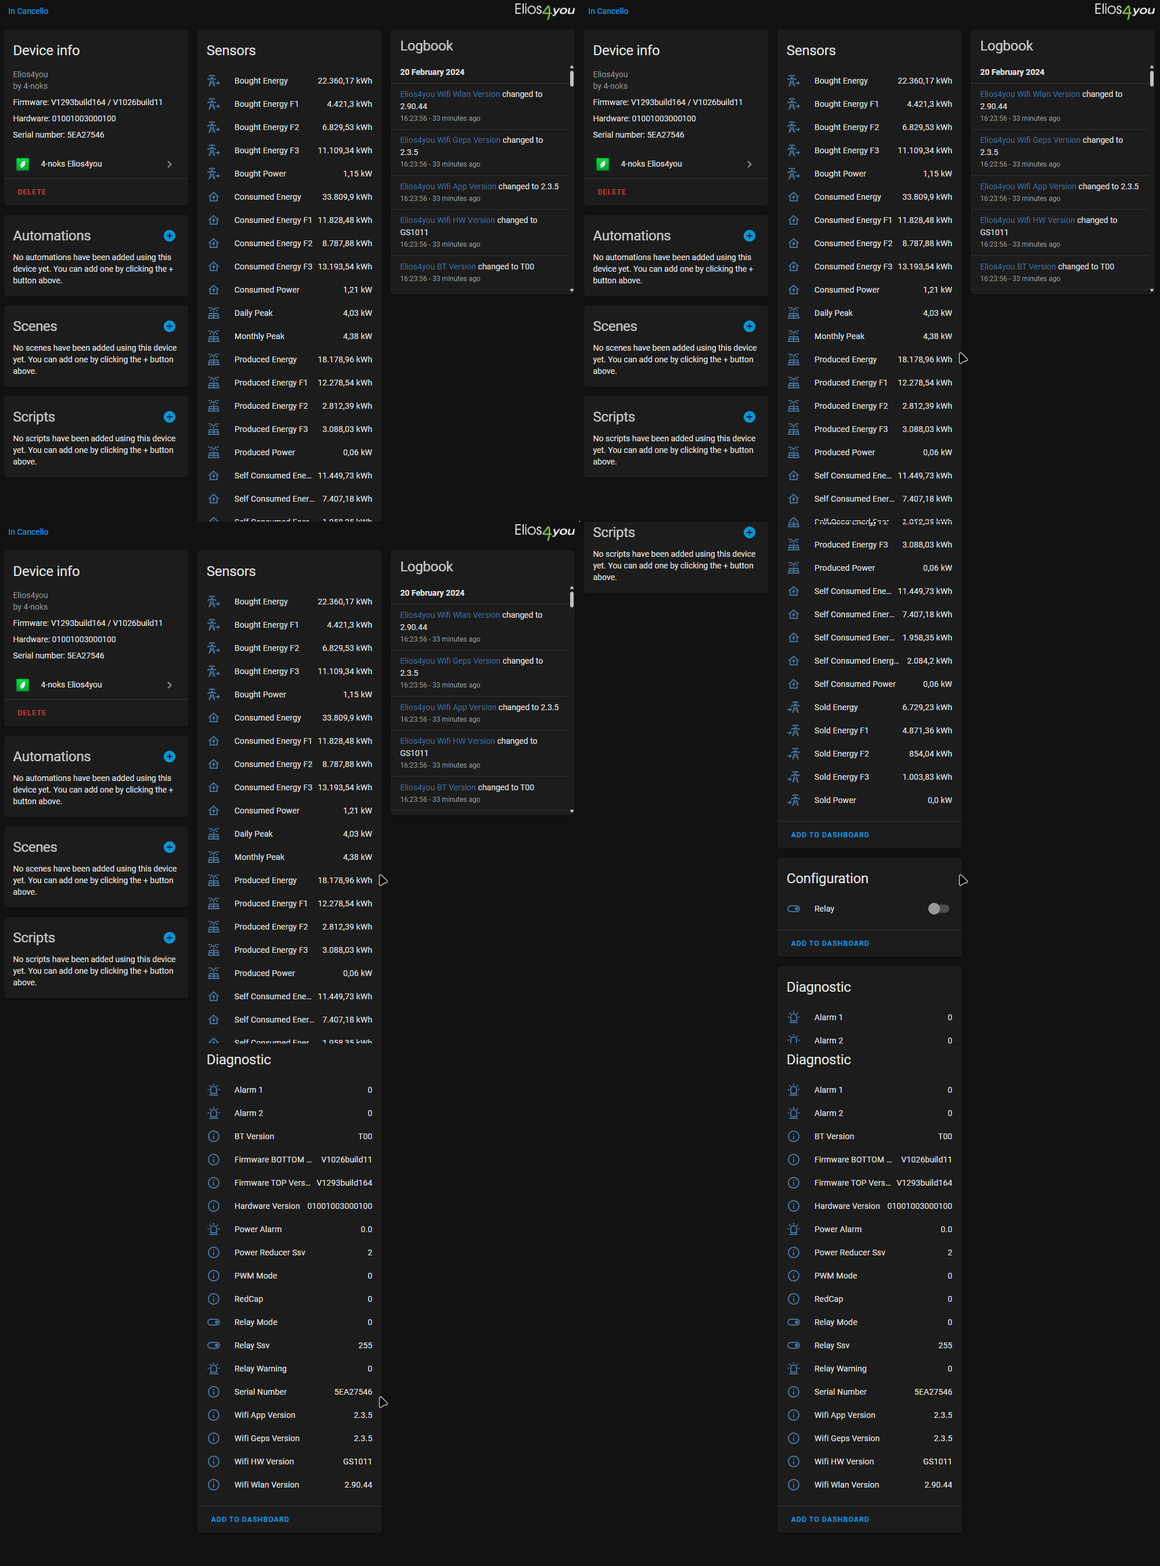
- Sensor entities for all data provided by the device (I don't even know what some of the ones in the diagnostic category specifically represent)
- Switch entity to control the device internal relay
- Configuration options: Name, hostname, tcp port, polling period
- Options flow: change polling period at runtime without restart
- Reconfigure flow: change connection settings (name, host, port) with automatic reload
- Repair notifications: connection issues are surfaced in Home Assistant's repair system
- Enhanced recovery notifications: detailed timing info (downtime, script execution) with persistent acknowledgment
- Device triggers: automate based on device connection events (unreachable, not responding, recovered)
- Diagnostics: downloadable diagnostics file for troubleshooting
The integration is split into two layers that talk to the device via telnetlib3:
api.py— a thin protocol/parser. It formats the@dat/@sta/@inf/@relcommands, parses the responses, and exposes the data that backs every sensor.connection_manager.py— owns the single TCP connection to the device, serialises every command, and decides when to reconnect, retry, abort, or back off.
The split exists because the Elios4you's embedded TCP stack has very few socket slots and
becomes unresponsive ("deaf") if it's hammered with reconnects. The ConnectionManager enforces
gentle behaviour through an explicit state machine
(DISCONNECTED → CONNECTING → READY → BACKOFF, terminal CLOSED on unload):
- Async I/O — every operation yields to the Home Assistant event loop; no blocking calls
- Connection reuse — the same TCP session is kept open for up to 90 s, so the default 60 s poll cadence usually shares one socket instead of opening a new one each time
- Single retry on transient command failures (silent timeout, mid-command transport error);
the manager closes the failed socket with TCP RST (
transport.abort()) so the device frees its slot immediately instead of waiting out CLOSE_WAIT - Bounded close —
wait_closed()is capped so a misbehaving device cannot hang the integration - Exponential backoff after 3 consecutive failures (5 s → 60 s). While in backoff, the manager refuses to even attempt a new connection, giving the device a chance to recover
- Serialised access — a single
asyncio.Lockmeans polls and switch commands never race - Structured logging — every state transition and connection event is logged with the
(ConnMgr.*)prefix (see Troubleshooting below) - Diagnostic sensors — 12 metrics (state, consecutive failures, silent timeouts, forced aborts, reuse hits, etc.) are exposed as opt-in sensors under the device's Diagnostic section so you can watch what the manager is doing without enabling debug logs
- Single device per integration instance: Each Elios4you device requires a separate integration instance. To monitor multiple devices, add the integration multiple times.
- Open HACS in your Home Assistant instance
- Click on "Integrations"
- Click the three dots menu in the top right corner
- Select "Custom repositories"
- Add
https://github.com/alexdelprete/ha-4noks-elios4youas an Integration - Click "Download" and install the integration
- Restart Home Assistant
- Download the latest release from GitHub Releases
- Extract the
custom_components/4noks_elios4youfolder - Copy it to your Home Assistant
config/custom_components/directory - Restart Home Assistant
This integration is available in HACS official repository. Click this button to open HA directly on the integration page so you can easily install it:

- Either click the button above, or navigate to HACS in Home Assistant and:
- 'Explore & Download Repositories'
- Search for '4-noks Elios4You'
- Download
- Restart Home Assistant
- Go to Settings > Devices and Services > Add Integration
- Search for and select '4-noks Elios4You' (if the integration is not found, do a hard-refresh (ctrl+F5) in the browser)
- Proceed with the configuration
Download the source code archive from the release page. Unpack the archive and copy the contents of custom_components folder to your home-assistant config/custom_components folder. Restart Home Assistant, and then the integration can be added and configured through the native integration setup UI. If you don't see it in the native integrations list, press ctrl-F5 to refresh the browser while you're on that page and retry.
Configuration is done via config flow right after adding the integration. The integration provides two ways to modify settings after initial setup:
Change runtime options without restarting Home Assistant:
| Option | Description | Default |
|---|---|---|
| Recovery script | Script to run when device stops responding. See Recovery Script below | None |
| Enable repair notifications | Show persistent notifications when device recovers from failures | Enabled |
| Failures before notification | Number of consecutive failures before triggering repair notification (1-10) | 3 |
| Polling period | Frequency in seconds to read data and update sensors (30-600) | 60 |
You can configure a script that automatically runs when the device becomes unreachable. This is useful for automated recovery actions like restarting your WiFi router or power-cycling network equipment.
Setup:
- Create a script in Home Assistant (e.g.,
script.restart_wifi) - In the integration's Options flow, select the script from the dropdown
- When failures exceed the threshold, the script will execute automatically
Available Variables:
The script receives these variables that you can use in your automation:
| Variable | Description | Example |
|---|---|---|
device_name |
The configured device name | "Elios4you Pro" |
host |
IP address or hostname | "192.168.1.100" |
port |
TCP port number | 5001 |
serial_number |
Device serial number | "E4U123456789" |
mac_address |
Device MAC address | "AA:BB:CC:DD:EE:FF" |
failures_count |
Number of consecutive failures | 3 |
Example Script:
script:
  restart_elios_wifi:
    alias: "Restart Elios WiFi AP"
    sequence:
      - service: switch.turn_off
        target:
          entity_id: switch.wifi_ap_power
      - delay:
          seconds: 10
      - service: switch.turn_on
        target:
          entity_id: switch.wifi_ap_power
      - service: notify.mobile_app
        data:
          title: "Elios4you Recovery"
message: "Restarted WiFi AP for {{ device_name }} after {{ failures_count }} failures"Change connection settings - the integration will automatically reload:
- Custom name: custom name for the device, used as prefix for sensors created by the component
- IP/hostname: IP/hostname of the device - this is used as unique_id, if you change it you will lose historical data (tip: use hostname so you can change IP without losing data)
- TCP port: TCP port of the device. tcp/5001 is the only known working port, but left configurable

The integration provides device triggers that allow you to create automations based on device connection events. These triggers fire when the Elios4you device experiences connectivity issues or recovers from them.
| Trigger | Description |
|---|---|
| Device unreachable | Fires when the device cannot be reached on the network (TCP connection failed) |
| Device not responding | Fires when the device is reachable but not responding to telnet commands |
| Device recovered | Fires when the device starts responding again after a failure |
- Go to Settings > Automations & Scenes > Create Automation
- Click Add Trigger and select Device
- Select your Elios4you device
- Choose from the available triggers (e.g., "Device unreachable")
Get notified when your Elios4you device goes offline and comes back online:
automation:
  - alias: "Elios4you Device Offline Alert"
    trigger:
      - platform: device
        domain: 4noks_elios4you
        device_id: YOUR_DEVICE_ID
        type: device_unreachable
    action:
      - service: notify.mobile_app
        data:
          title: "Elios4you Offline"
          message: "The Elios4you device is unreachable. Check network connection."

  - alias: "Elios4you Device Recovered"
    trigger:
      - platform: device
        domain: 4noks_elios4you
        device_id: YOUR_DEVICE_ID
        type: device_recovered
    action:
      - service: notify.mobile_app
        data:
          title: "Elios4you Online"
message: "The Elios4you device is back online and responding."When the device recovers from a failure, the integration creates a persistent repair notification with detailed timing information:
- Failure started: When the issue began
- Script executed: When the recovery script ran (if configured in options)
- Recovery time: When the device became responsive again
- Total downtime: Duration of the outage (e.g., "5m 23s")
These notifications appear in Settings > System > Repairs and require user acknowledgment to dismiss.
Here are some practical automation examples using the Elios4you sensors.
Get notified when your solar panels start producing energy in the morning:
automation:
  - alias: "Solar Production Started"
    trigger:
      - platform: numeric_state
        entity_id: sensor.elios4you_produced_power
        above: 0.1
    condition:
      - condition: sun
        after: sunrise
    action:
      - service: notify.mobile_app
        data:
          title: "Solar Production"
message: "Solar panels are now producing {{ states('sensor.elios4you_produced_power') }} kW"Alert when power consumption exceeds a threshold:
automation:
  - alias: "High Power Consumption Alert"
    trigger:
      - platform: numeric_state
        entity_id: sensor.elios4you_consumed_power
        above: 5.0
        for:
          minutes: 5
    action:
      - service: notify.mobile_app
        data:
          title: "High Power Usage"
message: "Power consumption is {{ states('sensor.elios4you_consumed_power') }} kW for 5 minutes"Add sensors to the Home Assistant Energy Dashboard:
- Go to Settings > Dashboards > Energy
- Under "Solar Panels", add
sensor.elios4you_produced_energy - Under "Grid consumption", add
sensor.elios4you_bought_energy - Under "Return to grid", add
sensor.elios4you_sold_energy
Send a daily summary of energy production and consumption:
automation:
  - alias: "Daily Energy Summary"
    trigger:
      - platform: time
        at: "21:00:00"
    action:
      - service: notify.mobile_app
        data:
          title: "Daily Energy Report"
          message: >
            Today's peak: {{ states('sensor.elios4you_daily_peak') }} kW
Self-consumption: {{ states('sensor.elios4you_self_consumed_power') }} kWAutomatically enable the relay when solar production exceeds consumption:
automation:
  - alias: "Enable Relay on Excess Solar"
    trigger:
      - platform: template
        value_template: >
          {{ states('sensor.elios4you_produced_power') | float >
             states('sensor.elios4you_consumed_power') | float + 1.0 }}
    action:
      - service: switch.turn_on
        target:
          entity_id: switch.elios4you_relay

  - alias: "Disable Relay on Low Solar"
    trigger:
      - platform: template
        value_template: >
          {{ states('sensor.elios4you_produced_power') | float <
             states('sensor.elios4you_consumed_power') | float }}
    action:
      - service: switch.turn_off
        target:
entity_id: switch.elios4you_relayAdd this to your configuration.yaml to enable debug logging:
logger:
  default: info
  logs:
    custom_components.4noks_elios4you: debug
Restart Home Assistant and check the logs in Settings > System > Logs.
When reporting issues, a full debug log is essential for diagnosis. Follow these steps to capture a complete log:
Add the logger configuration above to your configuration.yaml file, then restart Home Assistant.
After restart, wait for the issue to occur or manually trigger it. For connection problems, this usually happens within 1-2 polling cycles (60-120 seconds by default).
Method A: Via Home Assistant UI
- Go to Settings > System > Logs
- Click the Download Full Log button (top right corner)
- Save the
home-assistant.logfile
Method B: Direct File Access
Access the log file directly from your Home Assistant config directory:
- Home Assistant OS/Supervised:
/config/home-assistant.log - Docker:
<config_mount>/home-assistant.log - Core:
~/.homeassistant/home-assistant.log
The full log contains entries from all integrations. To extract only Elios4you entries:
Linux/macOS:
grep "4noks_elios4you" home-assistant.log > elios4you_debug.logWindows PowerShell:
Select-String -Path home-assistant.log -Pattern "4noks_elios4you" | Out-File elios4you_debug.logWindows Command Prompt:
findstr "4noks_elios4you" home-assistant.log > elios4you_debug.logThe integration uses structured logging with this format:
(function_name) [context_key=value]: message
Example log entries:
DEBUG (async_get_data): ========== READ CYCLE START ==========
DEBUG (ConnMgr.transition) [from_state=disconnected, to_state=connecting, reason=open_new]: State change
DEBUG (ConnMgr._ensure_connected) [host=192.168.1.100, port=5001, timeout=5.0]: Opening new connection
INFO  (ConnMgr._ensure_connected) [host=192.168.1.100, port=5001]: Connection established
DEBUG (ConnMgr.execute) [cmd=@dat, state=ready, attempts=2]: Command requested
DEBUG (ConnMgr._can_reuse) [age_seconds=58.3, reuse_window=90.0]: Connection exceeded reuse window
DEBUG (ConnMgr._close_safely) [previous_state=ready]: Connection aborted (RST sent)
WARN  (ConnMgr._record_failure) [consecutive_failures=3, backoff_seconds=5.0, last_error=silent_timeout]: Entering BACKOFF
ERROR (async_get_data) [host=192.168.1.100]: TelnetConnectionError - Connection timed out
Key prefixes to look for:
| Prefix | What it logs |
|---|---|
(ConnMgr.transition) |
State machine transitions (DISCONNECTED → READY → BACKOFF …) |
(ConnMgr._ensure_connected) |
Connection open / reuse decisions |
(ConnMgr._close_safely) |
Connection close (RST on errors, FIN on unload) |
(ConnMgr.execute) |
Per-command lifecycle: send, retry, success/failure |
(ConnMgr._record_failure) |
Failure counters + entering backoff |
(async_get_data) |
Top-level read cycle (calls @dat / @sta / @inf) |
(telnet_set_relay) |
Relay switch commands |
(async_setup_entry) |
Integration startup |
(async_unload_entry) |
Integration shutdown |
To target only the connection manager (skip the higher-level integration logs):
logger:
  default: warning
  logs:
    custom_components.4noks_elios4you.connection_manager: debug
Diagnostic sensors (no log analysis required): the integration exposes 12 sensors under the device's Diagnostic section. Four are enabled by default so connection health is visible out of the box:
Connection State— current link state (ready/connecting/backoff/ …).Connection Consecutive Failures— failure streak; non-zero means recovery is struggling.Connection Silent Timeouts— counts auto-recovered "device went deaf" events. This is the only sensor that surfaces them: silent timeouts are retried transparently, so they leaveConnection StateatreadyandConnection Consecutive Failuresat0. Watch this counter to know whether the device is still going deaf under the hood.Connection Last Error— last error message (empty when healthy); the most useful field when filing a bug report.
The remaining eight (Connection Backoff Remaining, Connection Reuse Hits,
Connection Connects Succeeded / Connect Failures, Connection Commands Sent / Failed / Retried, Connection Forced Aborts) are opt-in — enable them from the device page when you
want deeper telemetry. They make recurring problems visible without grepping logs.
For quick debugging without restarting, use the Logger integration service:
-
Go to Developer Tools > Services
-
Select service:
logger.set_level -
Enter this YAML:
service: logger.set_level
data:
  custom_components.4noks_elios4you: debug
-
Click Call Service
Debug logging is now enabled until the next restart. To disable:
service: logger.set_level
data:
custom_components.4noks_elios4you: infoThe integration uses Home Assistant's repair system to notify you of connection issues. If the device becomes unreachable, you'll see a repair notification in Settings > System > Repairs with troubleshooting steps.
Cause: The device is not responding to telnet commands.
Solutions:
- Verify the device is powered on and connected to the network
- Check that the IP address is correct in the integration configuration
- Ensure no firewall is blocking port 5001
- Try pinging the device:
ping <device_ip> - Verify the device's WiFi connection is stable
Cause: The device's embedded system can become overwhelmed by too many connections.
Solutions:
- Ensure only one integration instance is polling the device
- Close the official Elios4you mobile app when not in use
- Increase the polling interval to 120 seconds or more in Options
- Configure a recovery script to restart your WiFi access point
Cause: The device may have stale connections from the previous session.
Solutions:
- Wait 2-3 minutes for old connections to time out
- If issues persist, power cycle the Elios4you device
- Check for other services polling the device (Node-RED, etc.)
If you encounter problems, please open an issue on GitHub with:
- Debug logs - Enable debug logging (see above) and capture relevant log entries
- Diagnostics file - Download from Settings > Devices & Services > 4-noks Elios4you > 3-dot menu > Download diagnostics
- Home Assistant version - Found in Settings > About
- Integration version - Found in HACS > 4-noks Elios4you
- Problem description - What you expected vs what happened
This project uses a comprehensive test suite with 98% code coverage:
# Install development dependencies
pip install -e ".[dev]"

# Run tests with coverage
pytest tests/ --cov=custom_components/4noks_elios4you --cov-report=term-missing -v

# Run linting
ruff format .
ruff check . --fix
CI/CD Workflows:
- Tests: Runs pytest with coverage on every push/PR to master
- Lint: Runs ruff format, ruff check, and ty type checker
- Validate: Runs hassfest and HACS validation
- Release: Automatically creates ZIP on GitHub release publish
Contributions are welcome! Please follow these steps:
- Fork the repository
- Create a feature branch (
git checkout -b feature/my-feature) - Make your changes
- Run linting:
pre-commit run --all-files - Commit your changes (
git commit -m "feat: add my feature") - Push to your branch (
git push origin feature/my-feature) - Open a Pull Request
Please ensure all CI checks pass before requesting a review.
If you like this integration, I'll gladly accept some quality coffee, but please don't feel obliged. :)

This project is licensed under the MIT License - see the LICENSE file for details.
